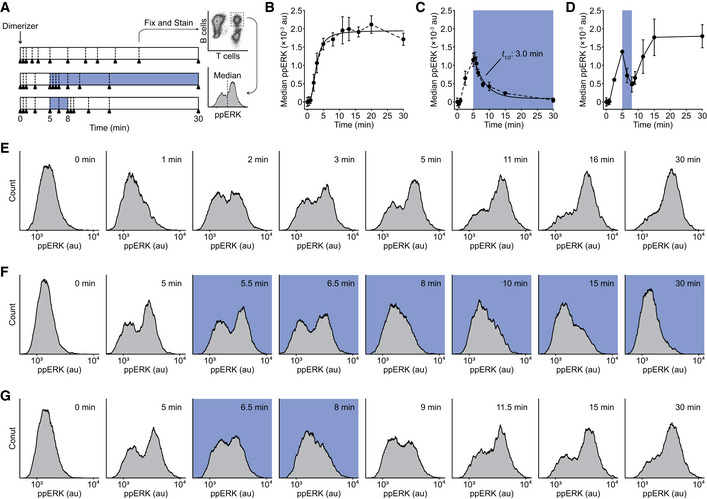
Figure 3. ERK activation remains sensitive to the state of proximal signaling.

-
ASchematic of the OptoCAR‐T cell experiment to follow the dynamics of ERK phosphorylation. Dimerizer was added to cell conjugates at 0 min, with samples (denoted by triangles) taken at defined points. Where sample illumination was used, this is shown by blue region. Samples were rapidly fixed and stained for doubly phosphorylated ERK (ppERK) before measuring the distribution of ppERK levels in cell conjugates.
-
BOptoCAR‐T cells were conjugated with ligand‐presenting cells and activated as in the upper regime shown in (A). The median of ppERK intensity distribution was plotted with time, after subtraction of background intensity. Bars show mean ± SEM (n = 3).
-
CAn equivalent experiment was performed as in (B) but following the middle regime shown in (A), with sample illumination after 5 min for the remainder of the dataset. Indicated half‐life was calculated from the time taken for the median ppERK to decrease to 50% of maximum. Bars show mean ± SEM (n = 4).
-
DAn equivalent experiment was performed as in (B) but following the lower regime shown in (A), with sample illumination after 5 min for 3 min. Bars show mean ± SEM (n = 3).
-
E–GA subset of ppERK distributions from individual datasets were used to create plots in (B–D), respectively. Blue boxes denote samples that were illuminated.
