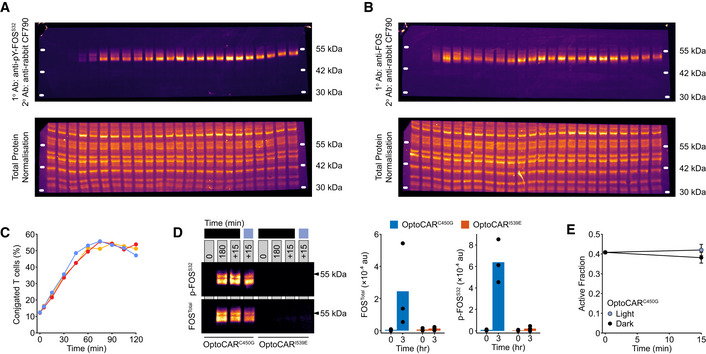
Figure EV3. Control experiments and uncropped Western blots for FOS activation datasets. Related to Fig 4 .

- Uncropped fluorescent Western blots from data presented in Fig 4A. The accompanying total protein normalization (TPN) blot for this Western is also provided in the lower image. The TPN blot is a more robust means to account for variable sample loading by visualizing all proteins blotted from the gel, rather than just one or two representative proteins, such as GAPDH or tubulin. Molecular weight markers were determined from an additional fluorescence channel.
- Uncropped fluorescent Western blots from data presented in Fig 4B. The accompanying total protein normalization blot for this blot is also provided in the lower image. Molecular weight markers were determined from an additional fluorescence channel.
- The fraction of OptoCAR‐T cells conjugated with Raji‐FRBEx cells over time was measured by flow cytometry. Dimerizer was added to the cells at the start of experiment, which drives more stable conjugates. Each colored line represents a replicate test.
- An equivalent assay was run as that shown in Fig 4 but using either the OptoCARC450G or OptoCARI539E variants. Conjugated OptoCAR‐T cells were activated with dimerizer, and samples were taken at 0 and 180 min. Samples were then either left in the dark state for a further 15 min are illuminated during this period. OptoCARI539E did not drive detectable levels of FOS expression as expected. Three independent replicates are presented in the right panel bar charts.
- Quantification of the active fraction from the experiments in (D) showed there was no significant effect of illumination on FOS activity. Bars show mean ± SEM (n = 3).
