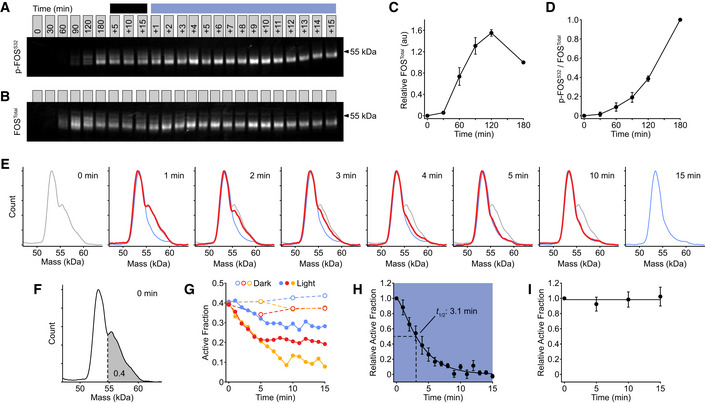
Representative fluorescent Western blot showing the dynamics of FOS phosphorylation (p‐FOS
S32) on light‐modulated control. Conjugated OptoCAR‐T cells were stimulated for a defined period after dimerizer addition (denoted above blots) before either being left in the dark (dark line) or illuminated (blue line). Full blot image with total protein normalization control shown in Fig
EV3A.
Representative fluorescent Western blot showing the dynamics of FOS expression (FOS
Total) on light‐modulated control, from the same dataset as in (A). Full blot image with total protein normalization control shown in Fig
EV3B.
Quantification of FOS expression detected by fluorescent Western blots at different time points prior to illumination. Datasets were corrected for background fluorescence and scaled to FOS level at 3 h. Bars show mean ± SEM (n = 3).
Quantification of the magnitude of phosphorylated FOS (p‐FOSS32) as a fraction of total FOS, detected by fluorescent Western blots at different time points prior to illumination. Datasets were scaled relative to phosphorylated FOS level at 3 h. Bars show mean ± SEM (n = 3).
Distributions of phosphorylated FOS molecular mass at different time points after illuminating OptoCAR‐T cell conjugates to disrupt signaling, quantified from blot in (A). The molecular mass distributions on initial illumination after 3 h of activation (0 min) and end of measurement (15 min) are shown as gray and blue lines, respectively. Distributions in other plots are shown as red lines that vary between these extremes.
A schematic to show how the active (higher molecular mass) fraction was estimated from the distributions in (E), with a cutoff of 0.4 defined by the 0 min distribution and used to analyze the datasets.
The data from three independent experiments (blue, red, and yellow) are shown either when FOS active fraction was measured in the dark (dashed lines) or under illumination (solid lines).
The light state datasets shown in (G) were combined and rescaled between the active fraction at 0 and 15 min. Indicated half‐life was calculated from the time taken for the activated fraction to decrease to 50% of maximum. Bars show mean ± SEM (n = 3).
The dark state datasets shown in (G) were similarly combined and rescaled, as in (H). Bars show mean ± SEM (n = 3).

