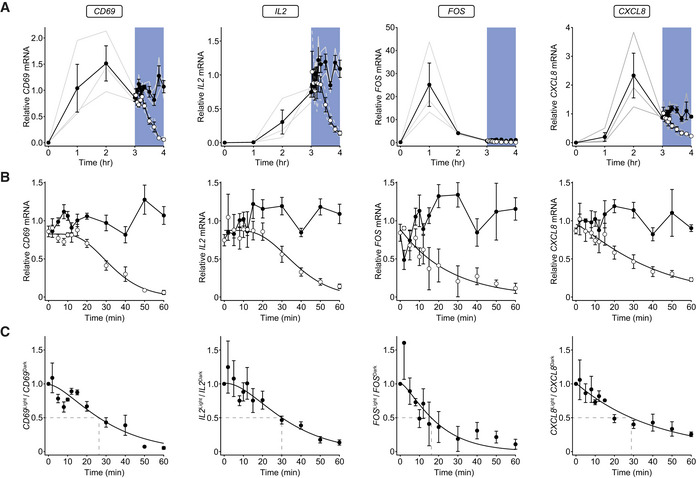
RT‐qPCR analysis of relative mRNA levels for four representative genes following OptoCAR‐mediated T‐cell activation. OptoCAR‐T cell conjugates were activated in the dark (signaling‐competent) state for a period of 3 h before light‐mediated disruption of signaling (open circles) or maintained for a further 60 min in the dark (filled circles). The relative mRNA values were calculated by subtracting baseline value before scaling to mean output between 3 and 4 h. Individual datasets are presented as gray lines, with bars showing mean ± SEM (
n = 3). Raw cRQ plots for all datasets are provided in Appendix Fig
S2, and RQ values can be found in Dataset
EV1.