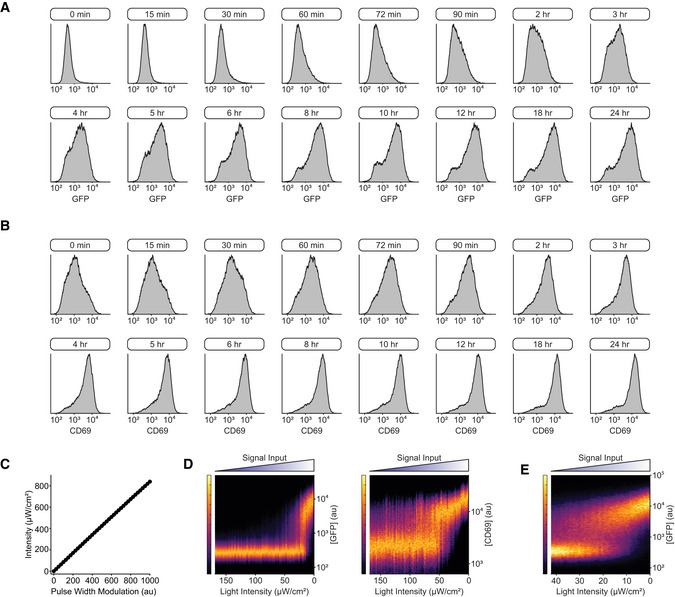
Figure EV5. Graded illumination of OptoCAR‐T cells drives both analogue and digital outputs.

- Flow cytometry plots showing the distribution of NFAT‐mediated GFP expression after different single‐pulse lengths (denoted in boxes above plots), measured after 24 h. A subset of pulse lengths is shown, ranging from 15 min to 24 h. These distributions were used to build the density plot in Fig EV4F.
- Flow cytometry plots showing the distribution of CD69 upregulation after different single‐pulse lengths (denoted in boxes above plots), measured after 24 h. A subset of pulse lengths is shown, ranging from 15 min to 24 h. These distributions were used to build the density plot in Fig EV4F.
- Plot showing the linearity between the pulse‐width modulation (PWM) value that controlled LED intensity and the corresponding light output on the optoPlate, which was used to calibrate the optoPlate in subsequent experiments.
- Density plot of NFAT‐mediated GFP expression (left) or CD69 upregulation (right) after 24 h of activation when OptoCAR‐T cell conjugates were continuously illuminated with varying light intensity. Plot is composed of 85 individual histograms.
- Density plot of NFAT‐mediated GFP expression as a function of light intensity continuously applied to OptoCAR‐T cells, as in (D). The new range of light intensities was selected to better resolve the bistable region in (D). Plot is composed of 96 individual histograms.
