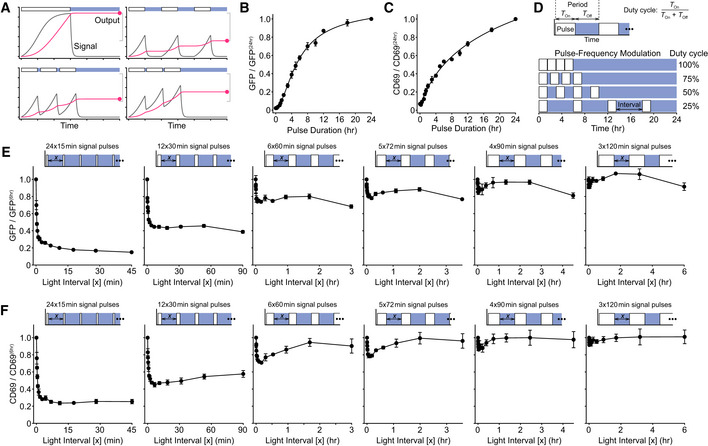
Figure 6. Short‐term signal persistence can be directly observed in gene expression output.

- Schematic showing the relationship between a signal (gray) and the corresponding output (red). A continuous signal pulse leads to maximal output (top left), whereas well‐separated pulses independently increase output (top right). When pulses are separated by shorter periods when signals persist, the combined output is increased between these two bounds (bottom row).
- Single pulses of varying duration were applied to OptoCAR‐T cells, and the geometric mean of GFP expression was measured for all pulse lengths 24 h after initiation of signaling, with illumination started once the signal pulse had ended. All values have been corrected for background GFP fluorescence from non‐activated OptoCAR‐T cells and shown relative to the output at 24 h. A representative dataset is provided in Fig EV4F. Bars show mean ± SEM (n = 3)
- Equivalent datasets as in (B) for the geometric mean of CD69 upregulation. A representative dataset is provided in Fig EV4F. Bars show mean ±SEM (n = 3)
- Schematic illustrating the pulse‐frequency modulation of signal pulses in OptoCAR‐T cells. For a given pulse duration, the length of the light interval between pulses was varied between duty cycles of 100% (continuous) and 25%. The output after 24 h was measured for all samples.
- Series of experiments showing how NFAT‐mediated GFP expression is modulated by pulsatile trains of signaling. A combined signaling period of 6 h was broken into signal pulses ranging from 15 min to 2 h and the light‐induced “off” interval between these pulses varied, denoted as x in the schematic above each plot. Geometric mean of GFP intensity is shown plotted as a function of light‐induced “off” interval, relative to a single, continuous 6‐h output. Bars show mean ± SEM (n = 3) of biological replicates.
- Series of experiments showing how CD69 upregulation is modulated by pulsatile trains of signaling, from same dataset as in (E). Bars show mean ± SEM (n = 3).
