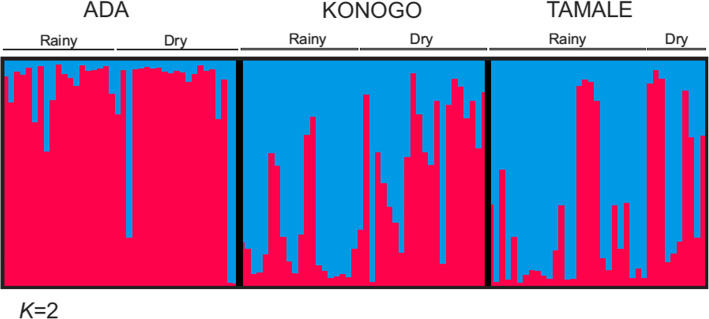
Fig. 5.
Genotype structure of parasite isolates. A Bayesian bar plot showing parasite genotype structure among samples from Tamale (Sahel zone), Konongo (Forest zone) and Ada (Coastal zone) of Ghana. Two most probable genetic clusters (red and blue) were determined. Each column represents a single sample and the color distribution in each column represents the proportion of the two clusters in each of the samples. Most of the parasite samples in the Sahel and Forest zones (Tamale and Konongo) shared the blue cluster for both rainy and dry seasons whereas parasites from the Coastal zone (Ada) had predominantly the red cluster

