Fig. 1.
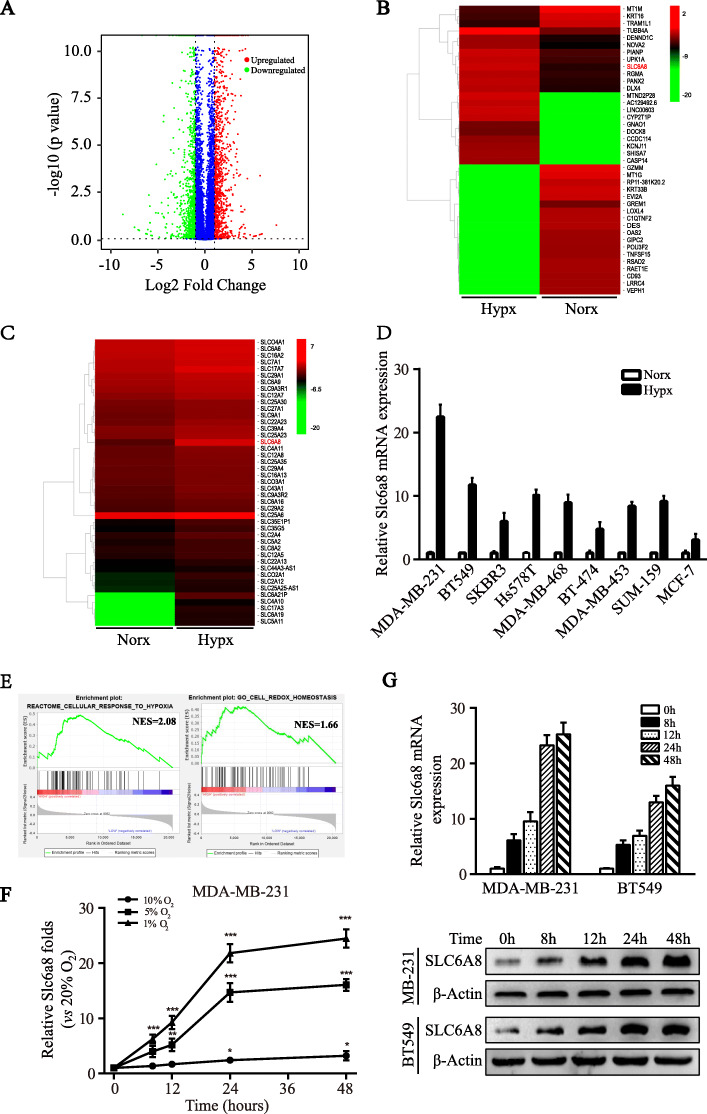
RNA expression profiles of hypoxic TNBC cells. a The volcano plot visualized RNA expression of TNBC cell MDA-MB-231 exposed to hypoxia (Hypx, 1% O2) vs normoxia (Norx, 20% O2) for 24 h. The red and green dots represented the significantly upregulated and downregulated RNAs, respectively. b A heat map showed the 50 most upregulated and downregulated RNAs in hypoxic MDA-MB-231 cells. c A heat map showed the upregulated RNAs encoding solute carrier family transporters. d The hypoxic induction of Slc6a8 mRNA expression in various breast cancer cells was detected by qRT-PCR. e Gene set enrichment analysis (GSEA) showed that Slc6a8 expression was positively associated with cellular response to hypoxia and redox homeostasis. f Time- and oxygen concentration-dependent upregulation of Slc6a8 expression in MDA-MB-231 was detected by qRT-PCR. g Time dependent upregulation of Slc6a8 mRNA and SLC6A8 protein expressions in MDA-MB-231 and BT549 cells were validated by qRT-PCR and western blot, respectively. Data were presented as mean ± SD (*P < 0.05, **P < 0.01, ***P < 0.001)

