
Figure 2. Scatter plots of 27 significant CpGs associated with alcohol consumption in a within-pair model.
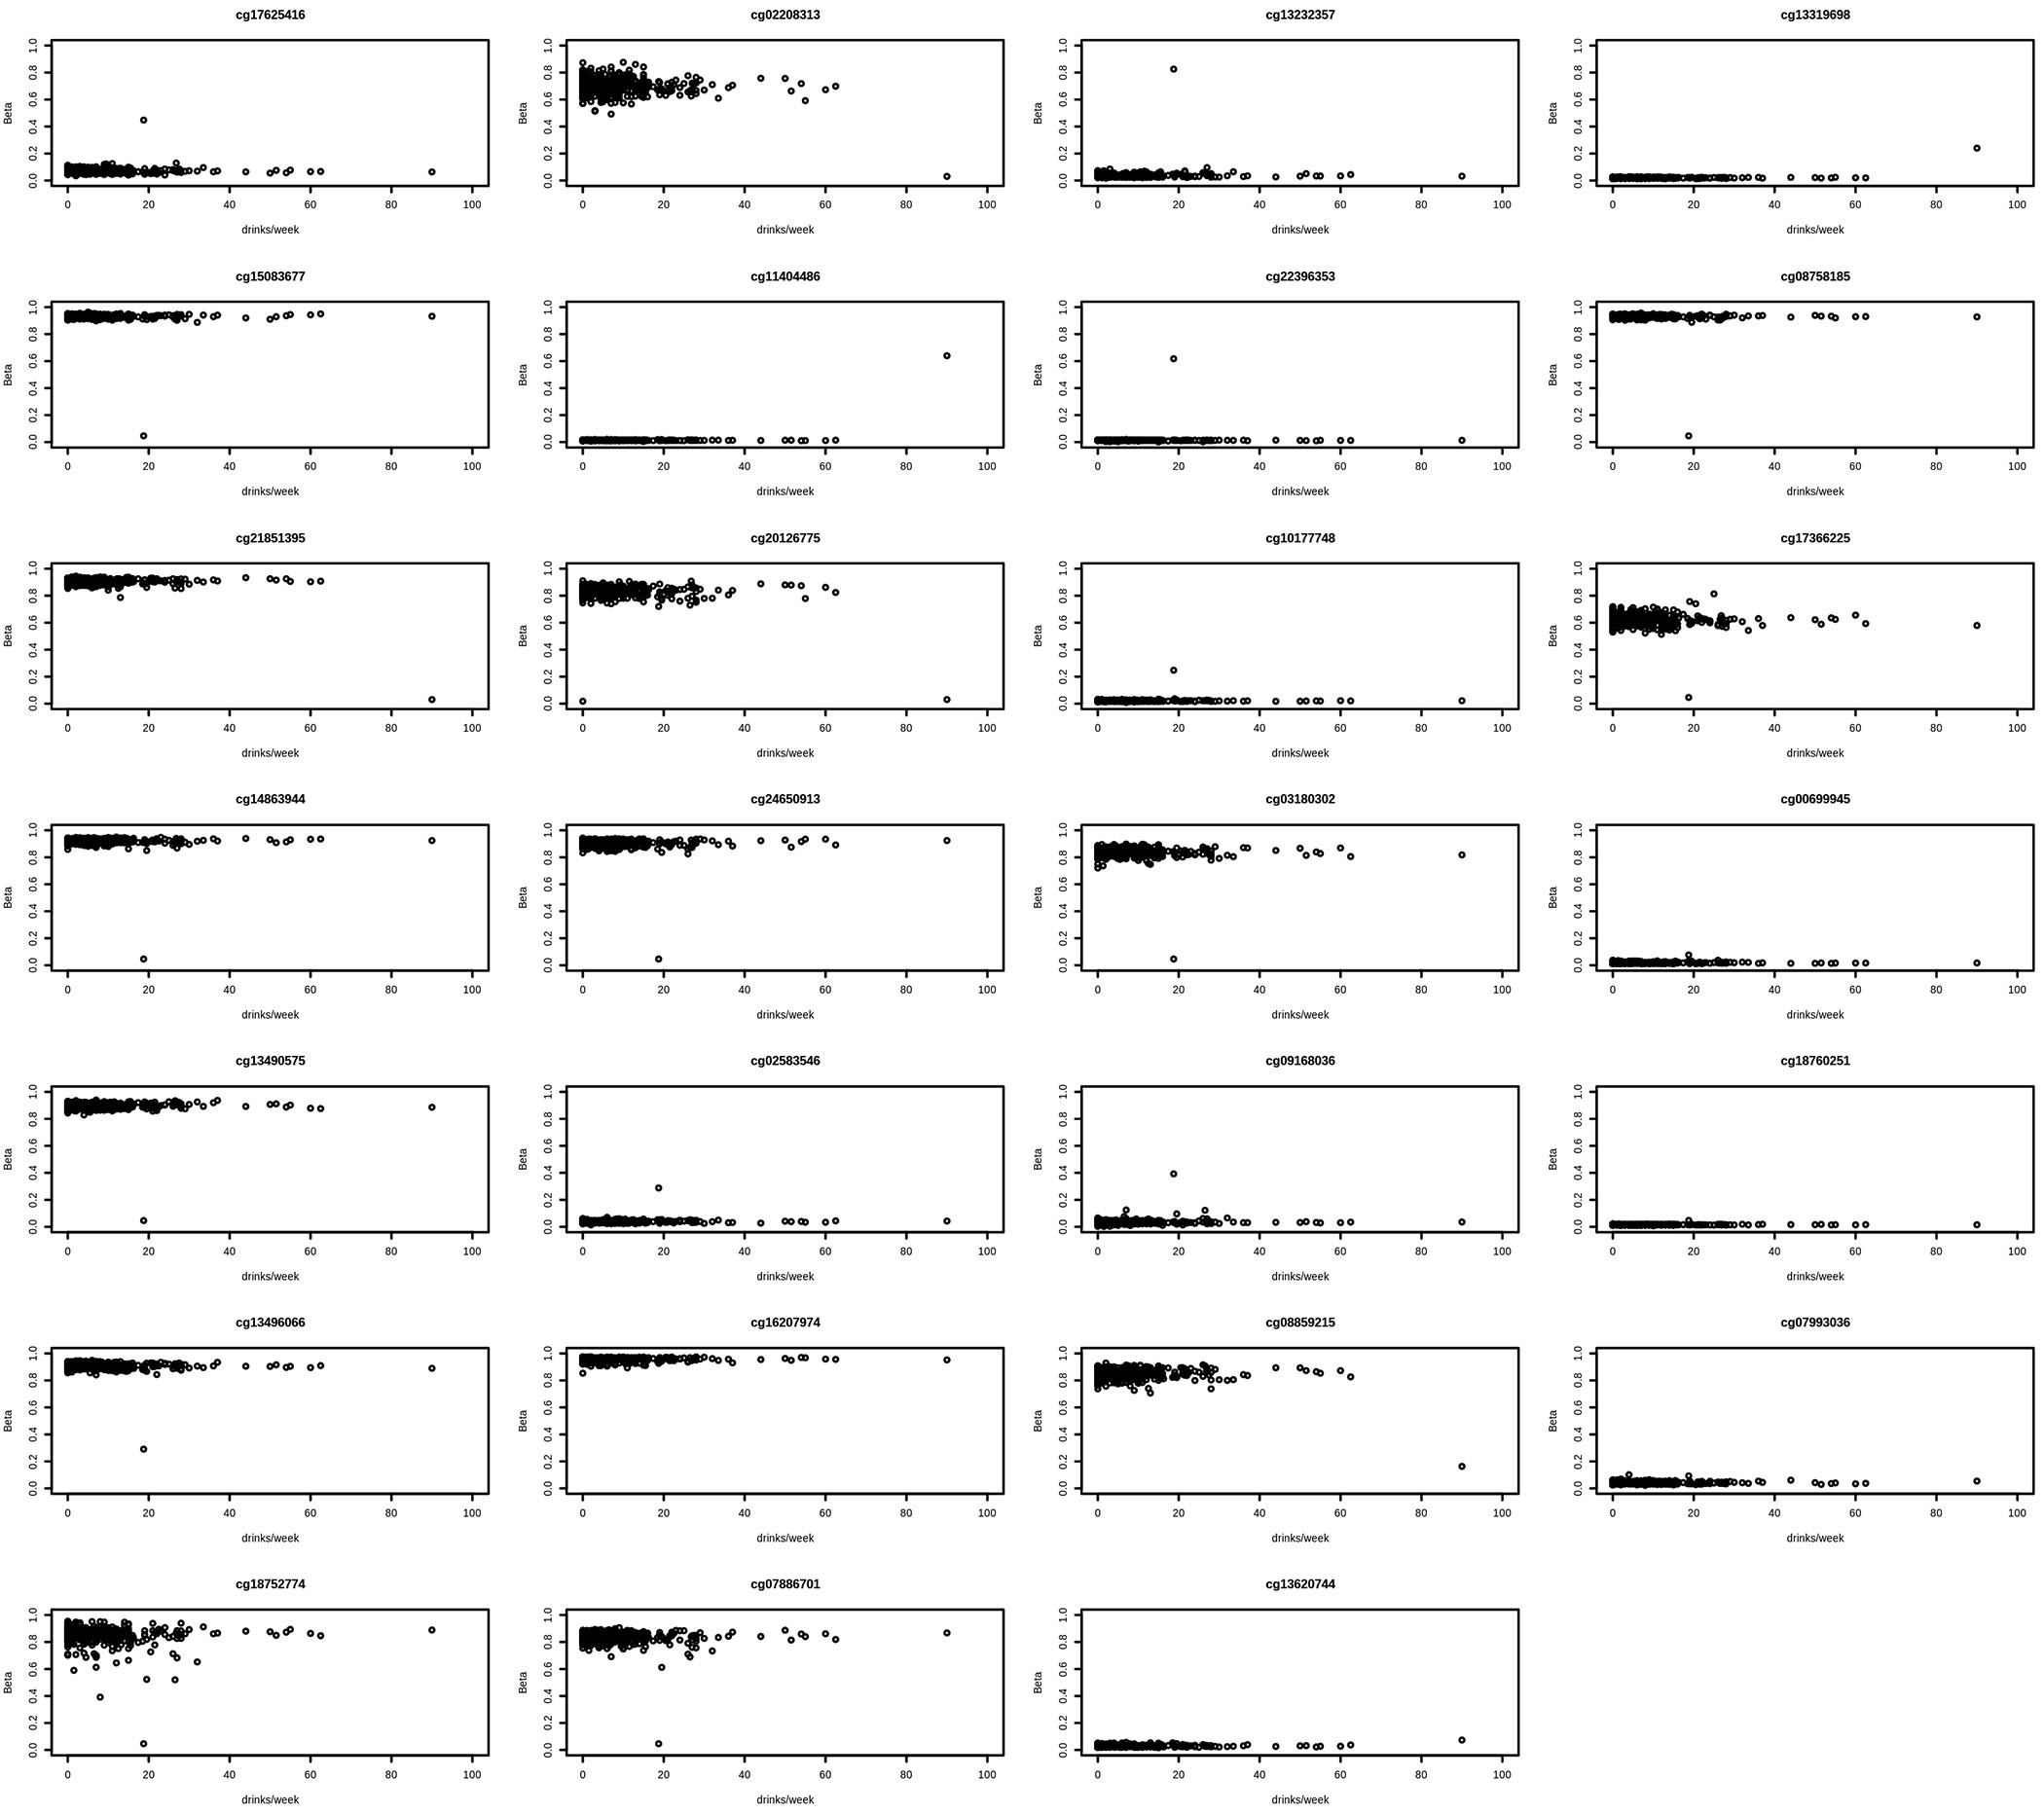
Figure 2 provides a visual representation of CpG sites significantly associated with alcohol consumption when examining differences within MZ twin pairs. Each plot represents a single CpG site with DNA methylation shown as beta (proportion of methylation at that site) on the y-axis and alcohol consumption shown as drinks per week on the x-axis.