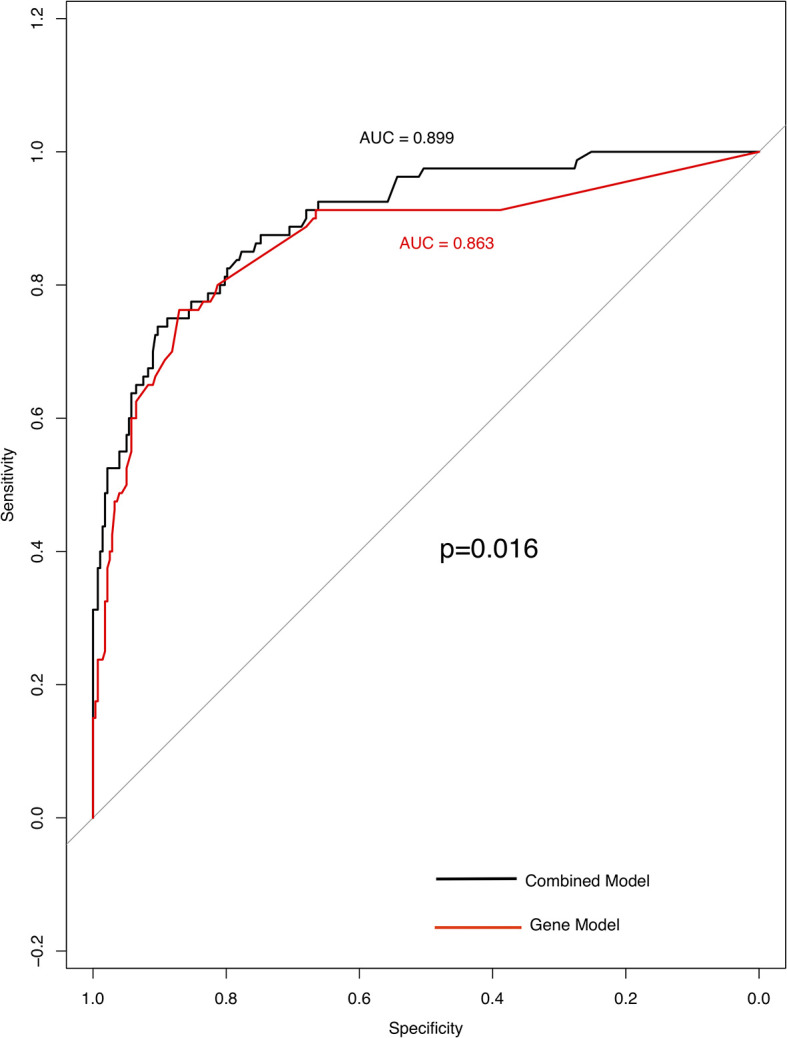
Figure 4.

High specificity of genes and clinical model for predicting TMB status. ROC curve analysis was used to determine the sensitivity and specificity of the two models. The black curve is the combined model; the area under the ROC curve is 0.899(95% confidence interval: 0.861–0.938). Curve in red is gene model; the area under the ROC curve is 0.863 (95% confidence interval: 0.811–0.916).
