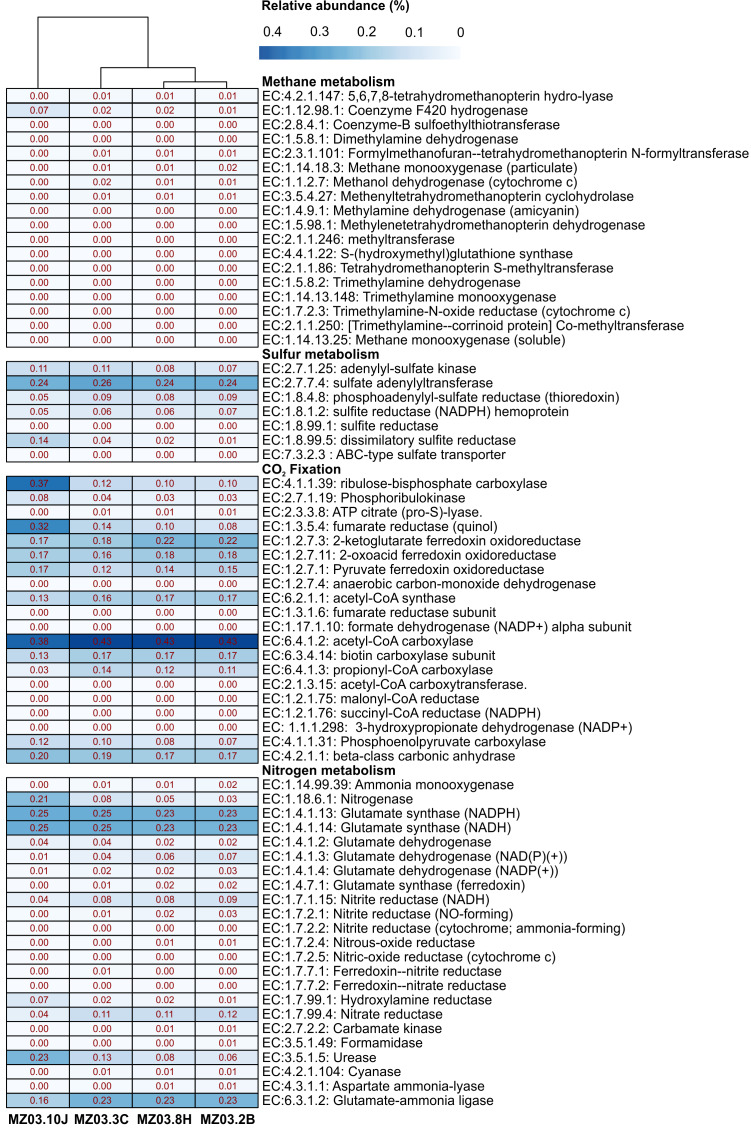
Figure 7. Predicted genes encoding enzymes.
Heat-map showing the relative abundances of PICRUSt2 predicted genes (Y axis) encoding the enzymes involved in methane, sulfur, nitrogen metabolism and CO2 fixation based on Metacyc database for each sampling point (X axis). The values for functional groups are marked by colors from white to red designating the least abundant to most abundant.

