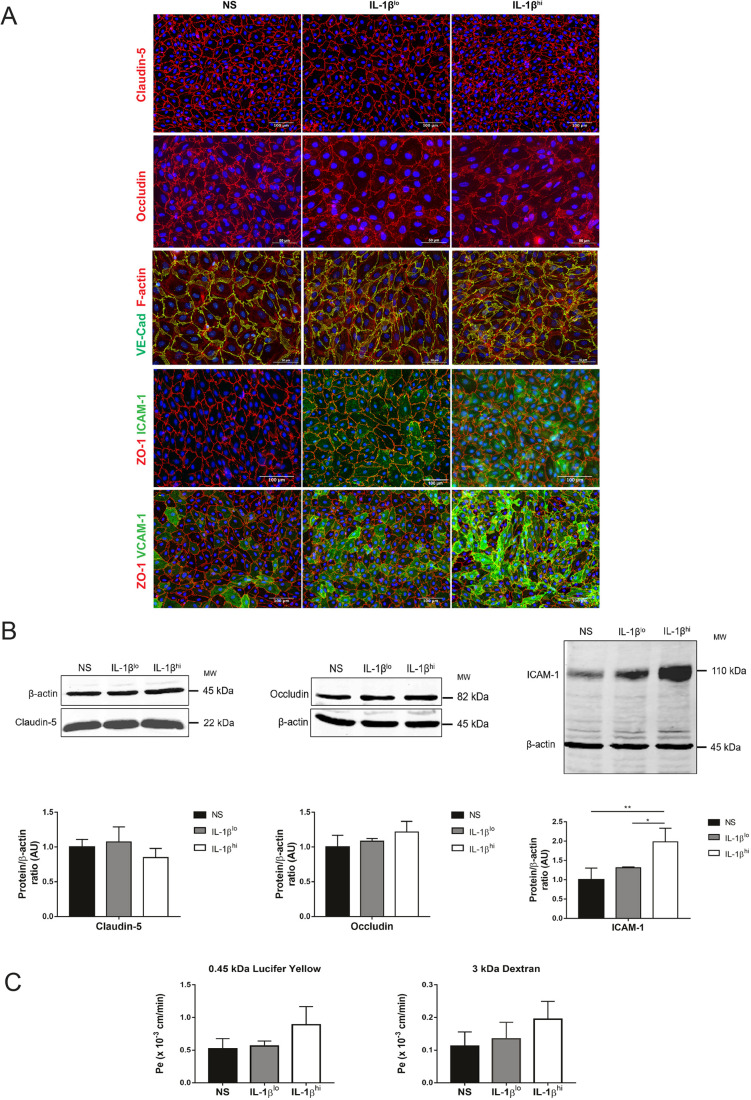
Fig. 1.
Phenotype and barrier characteristics of pMBMEC monolayers. (A) Immunofluorescence staining of non-stimulated (NS), IL-1βlo- or IL-1βhi-stimulated pMBMEC monolayers. Immunostaining for claudin-5 (red) or occludin (red), F-actin staining (red) in VE-Cadherin–GFP+ (green) pMBMECs, and immunostaining for ZO-1 (red) and either ICAM-1 or VCAM-1 (green) are shown. Nuclei are stained with DAPI (blue). Data are representative of three independent experiments. (B) Immunoblot analysis and quantification of claudin-5, occludin and ICAM-1 in non-stimulated, IL-1βlo- or IL-1βhi-stimulated pMBMECs is shown. β-actin is shown as a loading control used for normalization during quantification. Bar graphs show mean±s.d. of four independent experiments (AU, arbitrary units). *P<0.05; **P<0.01 (one-way ANOVA with a Tukey post hoc test). (C) Permeability of 0.45 kDa Lucifer Yellow and 3 kDa dextran across unstimulated, IL-1βlo- or IL-1βhi-stimulated pMBMEC monolayers is shown. Endothelial permeability coefficient (Pe) values were calculated as previously described (Steiner et al., 2011). Bar graphs show mean±s.d. of four independent experiments, with triplicates performed per condition.

