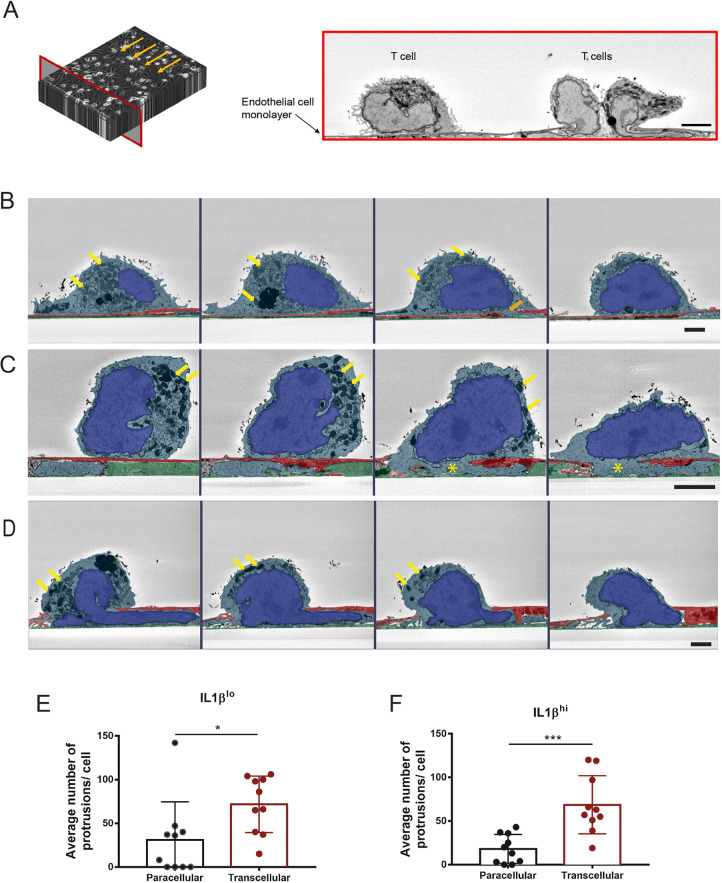
Fig. 2.
SBF-SEM of CD4+ TEM interacting with pMBMECs under physiological flow. (A) Scheme of the acquisition made using SBF-SEM (left) and corresponding representative image (right) of this frontal plane (red frame). Image collection was performed precisely against the direction of the flow (arrows). In the example chosen, three CD4+ TEM cells interacting with the endothelial monolayer are demonstrated. Scale bar: 1 µm. (B–D) Representative images of three different CD4+ TEM cells interacting with the pMBMEC monolayer under flow. For each T cell, four SBF-SEM image sections are shown, depicting the interaction of different frontal section planes of the same cell with the endothelium. Images are false colored to show endothelial cells in red, extracellular matrix in green, T cell cytoplasm in light blue and T cell nuclei in bright blue. In B, four images of the same T cell in close contact with the pMBMEC monolayer are shown. In the first, second and fourth images, no disruption of the pMBMEC monolayer by the T cell is visible. In the third image from the left, the orange arrow marks a T cell protrusion through the pMBMEC monolayer. The organelles of the T cell are visibly concentrated around the nucleus. Yellow arrows point to two exemplary mitochondria. In C, another T cell is sending a subendothelial protrusion across the pMBMEC monolayer, directly visible in sections three and four (highlighted with a yellow asterisk). Yellow arrows point to exemplary mitochondria accumulating at the rear of the T cell. In D, a third T cell is undergoing a diapedesis process, where part of the T cell nucleus is already seen underneath the endothelium. Yellow arrows highlight exemplary mitochondria concentrated at the rear of the T cell. The images were acquired at an angle perpendicular to the physiological flow. Scale bars:1 µm. (E,F) Quantification of the number of protrusions each T cell sent across the junctions or across the endothelial cell body of (E) IL-1βlo- or (F) IL-1βhi-stimulated pMBMECs. For both datasets, a total of ten T cells were evaluated under IL-1βlo and IL-1βhi stimulation, from four independent samples. Analysis was done by evaluating the SBF-SEM dataset using 3dmod software. Data are presented as mean±s.d. *P<0.05; ***P<0.01 (two-tailed, unpaired Student's t-test).

