Fig. 3.
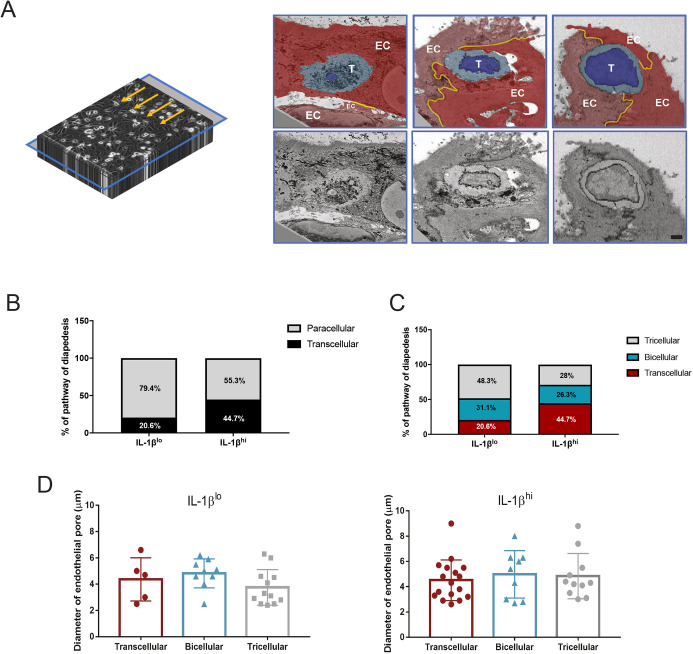
CD4+ TEM cells extravasate across tricellular junctions of the pMBMECs. (A) Scheme of the acquisition made using SBF-SEM (left) and correspondent representative images (right) of this transversal plane (blue frame). Turning the acquired image stack by 90° allowed us to visualize the precise transversal plane of the interaction between the T cell and the pMBMEC monolayer. The images highlight an example of a transcellular diapedesis (left), an example of a paracellular diapedesis via a bicellular junction (middle) and an example of paracellular diapedesis via a tricellular junction (right). The images in the top row are false colored to show the different endothelial cells in red colors, the T cell cytoplasm in light blue, the T cell nucleus in bright blue and the junctions in yellow. EC, one individual endothelial cell; T, T cell. Original images are shown in the lower row. Scale bar: 1 μm. (B,C) Quantification of the T cell diapedesis pathways observed with SBF-SEM, using 3dmod software. Bar graphs show quantification of either (B) transcellular (black) and paracellular (gray) diapedesis, or (C) transcellular (red), and paracellular diapedesis across bicellular (blue) and tricellular (gray) junctions, across IL-1βlo- or IL-1βhi-stimulated pMBMECs. For both datasets, we identified a total of 86 CD4+ TEM cells interacting with IL-1βlo-stimulated pMBMECs and 92 CD4+ TEM cells interacting with IL-1βhi-stimulated pMBMECs. Of those, a total of 26 and 37 cells were performing diapedesis, respectively, and the pathway of diapedesis was evaluated under IL-1βlo and IL-1βhi conditions from four independent samples. Data were normalized to 100%. (D) Measurement of the endothelial pore diameter generated by CD4+ TEM diapedesis through IL-1βlo- or IL-1βhi-stimulated pMBMECs, during transcellular diapedesis or paracellular diapedesis across bicellular or tricellular junctions. A total of 26 and 37 T cells were evaluated under IL-1βlo and IL-1βhi stimulation, respectively, from four independent samples. Analysis was performed by evaluating the SBF-SEM dataset with 3dmod software. Data are presented as mean±s.d. No statistical differences were found with a one-way ANOVA with a Tukey post hoc test.

