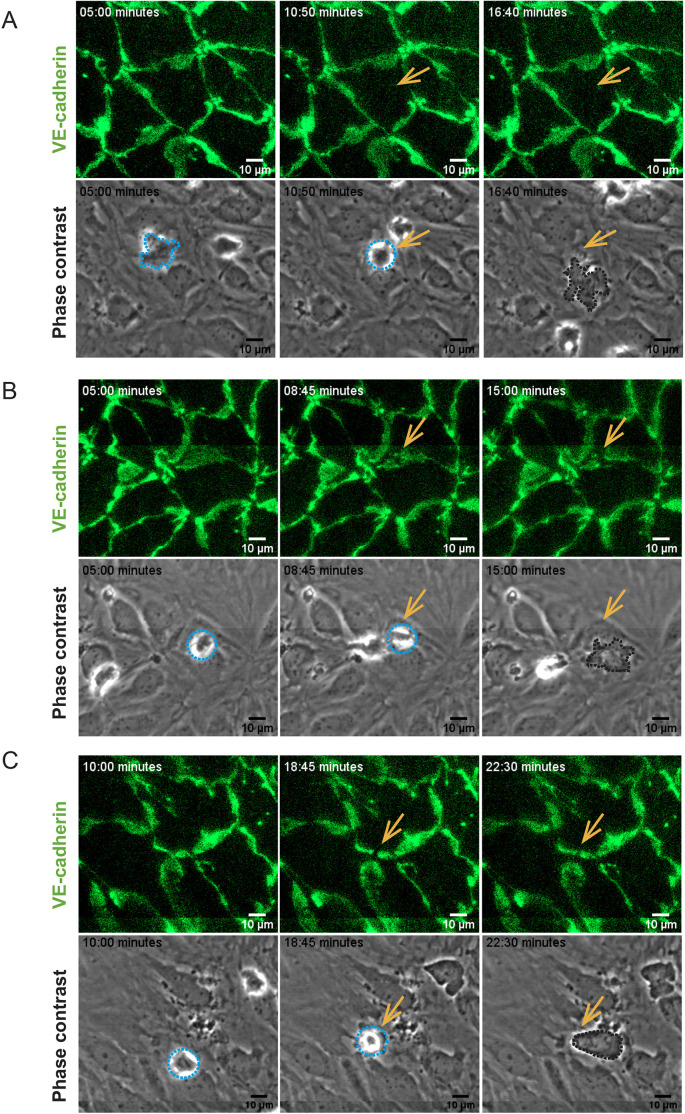
Fig. 4.
CD4+ TEM cell diapedesis pathways across VE-cadherin–GFP pMBMECs. Image series from time-lapse videos showing examples of transcellular diapedesis (A) or paracellular diapedesis across bicellular junctions (B) and tricellular junctions (C) over time. The top rows show VE-cadherin–GFP at the endothelial junctions. The bottom rows show the same field of view in phase-contrast images, highlighting CD4+ TEM cells interacting with the pMBMECs. T cell diapedesis sites are indicated by arrows, allowing for direct comparison of the absence or presence of a change in the VE-cadherin–GFP pattern with the behavior of the T cells on the pMBMEC monolayer. Junctional migration is visible as a gap in the junctional GFP signal. T cells are highlighted with the dashed lines, where light blue lines show T cells localized on top of the endothelium, whereas dark lines show a T cell below the pMBMEC monolayer. The relative time of image acquisition in minutes is indicated on the top left in each image. Image acquisition over the entire pMBMEC monolayer was divided into eight tiles, which were subsequently stitched together for analysis over the entire field of view. Lines visible in B and C result from the stitching process used to join the individual image tiles.

