Fig. 5.
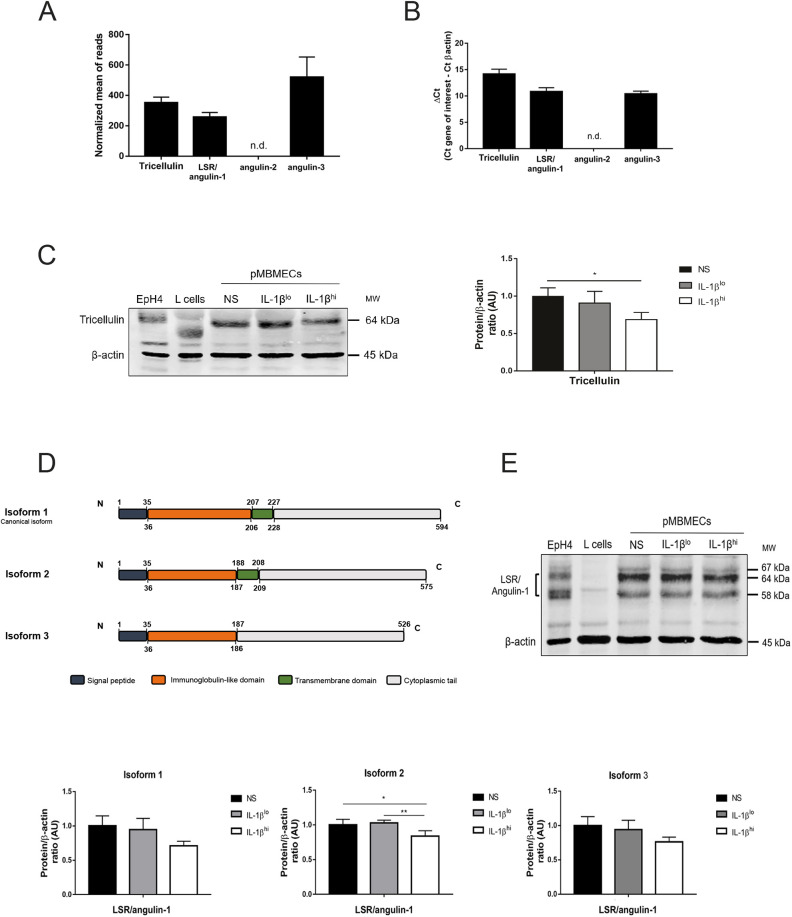
Components of the tricellular junctions are downregulated upon inflammatory conditions. (A) Normalized values of read counts for tricellulin and LSR/angulin-1 from an RNA sequencing analysis of non-stimulated pMBMECs, from five independent samples pooled from ten mice each. A threshold of 100 was established for the normalized reads, above which all transcripts were considered as expressed. Data are presented as mean±s.d. (B) Gene expression of tricellulin, LSR/angulin-1, angulin-2 and angulin-3 in non-stimulated pMBMECs was assessed by RT-qPCR. Relative quantification is represented by the ΔCT value (average CT value of target gene−average CT value of β-actin). Data are presented as mean±s.d. of three experiments. (C) Immunoblot analysis and quantification of the expression of tricellulin in non-stimulated (NS), IL-1βlo- or IL-1βhi-stimulated pMBMECs. EpH4 lysates and L cell lysates were used as positive and negative controls, respectively. β-actin is shown as a loading control used for normalization during quantification. Bar graphs show the mean±s.d. of three independent experiments. *P<0.05 (one-way ANOVA with a Tukey post hoc test). (D) Schematic representation of the isoforms of mouse LSR/angulin-1 and its domains. Numbers indicate the amino acid residues that comprise each domain. (E) Immunoblot analysis (top) and quantification (bottom) of the expression of LSR/angulin-1 isoforms (isoform 1, 67 kDa; isoform 2, 64 kDa; and isoform 3, 58 kDa) in unstimulated, IL-1βlo- or IL-1βhi-stimulated pMBMECs. EpH4 lysates and L cell lysates were used as positive and negative controls, respectively. β-actin is shown as a loading control used for normalization during quantification. Bar graphs show the mean±s.d. of four independent experiments. *P<0.05; **P<0.01 (one-way ANOVA with a Tukey post hoc test). AU, arbitrary units; n.d., not detected.

