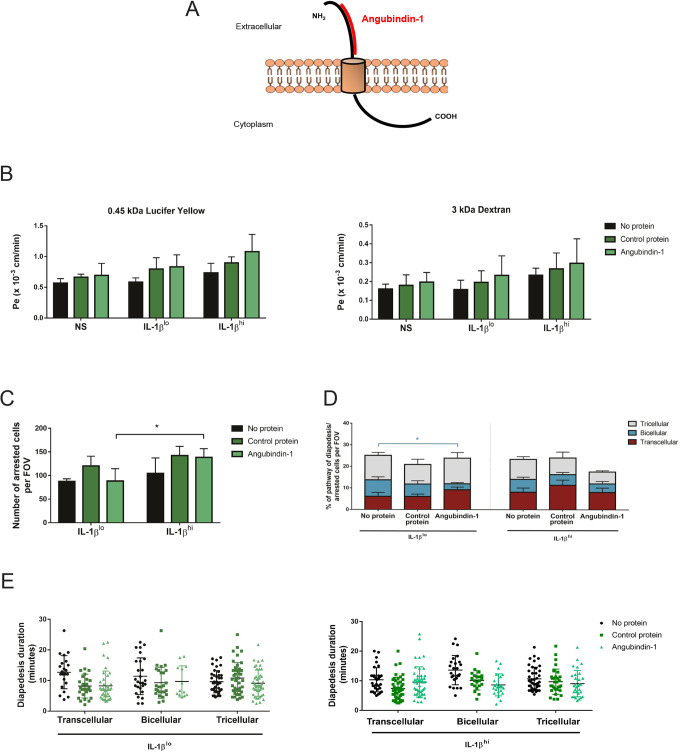
Fig. 6.
Targeting of LSR/angulin-1 by angubindin-1 in pMBMECs decreases paracellular CD4+ TEM cell diapedesis at bicellular junctions. (A) Schematic representation of the structure of LSR/angulin-1 and the binding site of angubindin-1 in its N-terminal region. The image was adapted from Servier Medical Art (http://smart.servier.com/), under the terms of a CC-BY 3.0 license. (B) Permeability of differently IL-1β-stimulated pMBMEC monolayers (NS, non-stimulated) to 0.45 kDa Lucifer Yellow (left) and 3 kDa dextran (right), in the presence or absence of the control protein and angubindin-1, as indicated. Endothelial permeability coefficient (Pe) values were calculated as previously described (Steiner et al., 2011). Bar graphs show mean±s.d. of three independent experiments, with three replicates per condition. (C) Mean number of arrested CD4+ TEM cells in IL-1βlo- or IL-1βhi-stimulated endothelium, per field of view (FOV), while targeting LSR/angulin-1 with angubindin-1 as indicated. Bar graphs show mean±s.d. of three experiments. *P<0.05 (one-way ANOVA with a Tukey post hoc test). (D) Quantification of transcellular (red), bicellular junctional (blue) and tricellular junctional (gray) diapedesis events of CD4+ TEM cells across IL-1βlo- or IL-1βhi-stimulated pMBMECs in the presence or absence of the control protein and angubindin-1, as indicated. Both IL-1β and protein stimulations were performed simultaneously for 16 h. In each condition, 100 diapedesis events were evaluated and normalized to the respective number of arrested CD4+ TEM cells per FOV, from at least four videos from three independent experiments. Stacked bar graphs show mean±s.d. *P<0.05 (one-way ANOVA with a Tukey post hoc test). (E) Duration of CD4+ TEM cell diapedesis through transcellular, bicellular junctional or tricellular junctional pathways, across IL-1βlo- or IL-1βhi-stimulated pMBMECs, in the presence or absence of the control protein and angubindin-1, as indicated. Each data point represents an individual CD4+ TEM cell. The duration of the diapedesis of 100 cells was evaluated per condition, from a total of three independent experiments. Individual data points are plotted, with mean and s.d. indicated.

