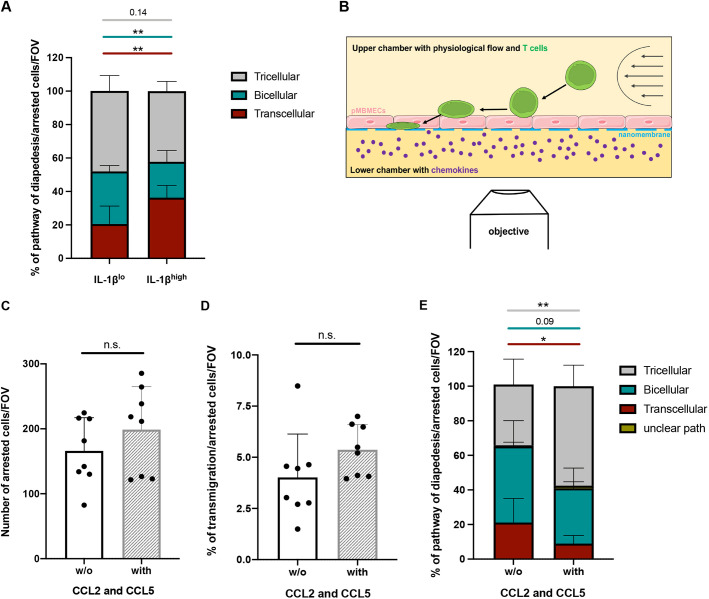
Fig. 8.
Abluminal chemokines increase CD4+ Th1 cell diapedesis via tricellular junctions of pMBMECs. (A) Cumulative analysis of transcellular (red), bicellular (teal) and tricellular (gray) diapedesis events of CD4+ Th1 cells across IL-1βlo- or IL-1βhi-stimulated pMBMECs, as shown in Figs 6D and 7E (conditions no protein). In each condition, 100 diapedesis events were evaluated and normalized to the respective number of arrested CD4+ Th1 cells per field of view (FOV), from at least four videos from four independent experiments. Stacked bar graphs show mean±s.d. **P<0.01 (one-way ANOVA with a Tukey post hoc test). (B) Schematic representation of in vitro live imaging of T cell extravasation across primary mouse brain microvascular endothelial cells (pMBMECs) cultured on nanoporous silicon nitride (NPN) membranes (µSiM-CVB) under physiological flow conditions (from right to left; arrows) with recombinant mouse CCL2 and CCL5 (both 100 ng/ml) in the bottom compartment. (C) Mean number of arrested Th1 cells on IL-1βhi-stimulated pMBMECs under physiological flow conditions in the µSiM-CVB assay, in the presence (with) or absence (w/o) of CCL2 and CCL5 in the bottom channel. (D) Mean percentage of transmigrated Th1 cells across IL-1βhi-stimulated pMBMECs in the µSiM-CVB assay, in the presence or absence of CCL2 and CCL5. Each data point shown in C,D represents the mean of the two FOVs per movie. (E) Quantification of transcellular (red), bicellular (teal) and tricellular (gray) diapedesis events of Th1 cells across IL-1βhi-stimulated pMBMECs in the µSiM-CVB assay. Events with an unclear transmigration path are shown in yellow. Data in C–E are mean±s.d. of three experiments, with at least duplicates for each condition. *P<0.05; **P<0.01; n.s., not significant (two-tailed, unpaired t-test).

