Abstract
Intrauterine growth restriction (IUGR) leads to offspring obesity. In a maternal food restriction (MFR) during pregnancy-related IUGR rat model, bone marrow stem cells showed enhanced adipogenic programming; however, the effect of IUGR on white adipose tissue (WAT) progenitors is unknown. Here, by mRNA and functional profiling, we determined sex-specific adipogenic programming of WAT progenitors isolated from pups on postnatal day (PND) 1 and 21. On PND1, PPARγ and Pref-1 expression was significantly downregulated in preadipocytes of both MFR males and females; however, at PND21, preadipocytes of MFR males showed upregulation in these genes. Even following adipogenic induction, both male and female MFR adipocytes exhibited lower PPARγ, ADRP, and adiponectin levels at PND1; however, at PND21 MFR male adipocytes showed an upward trend in the expression of these genes. An adipogenesis-specific RT-PCR array showed that male MFR adipocytes were programmed to exhibit stronger adipogenic propensity than females. Lastly, serum sex hormone and adipocyte estrogen/testosterone receptor expression profiles provide preliminary insights into the possible mechanism underlying sex-specific adipogenic programming in the IUGR offspring. In summary, IUGR programs WAT preadipocytes to a greater adipogenic potential in males. Although the altered adipogenic programming following MFR was detectable at PND1, the changes were more pronounced at PND21, suggesting a potential role of postnatal nutrition in facilitating the sex-specific adipogenic programming in the IUGR offspring.
Keywords: Adipogenesis, adipocytes, preadipocytes, obesity, white adipose tissue
INTRODUCTION
The prevalence of obesity/overweight among US adults is 70.2% (2013-14 National Health and Nutrition Examination Survey). The prevalence is about 10% higher in males.(1) Obesity-related conditions such as heart disease, stroke, type 2 diabetes, and certain types of cancer are the leading causes of preventable, premature death. The incidence of morbidities due to obesity is also higher in males, which can be attributed to an overall increasing trend of overweight and obesity in this group.
The etiology of obesity is complex and often multifactorial. Although imbalance between caloric intake and output seems to be a major contributor,(2) it is the complex interaction between genetic, environmental, and behavioral factors that makes an individual more susceptible to develop obesity. There is convincing evidence that postnatal adaptive or maladaptive environment modifies the thrifty phenotype, induced following intrauterine nutritional stress, that is associated with later obesity and metabolic syndrome.(3) This phenomenon, termed “fetal programming”, and the consequent “fetal origins of adult diseases” has been well described in offspring following intrauterine growth restriction (IUGR),(4–6) but the underlying cellular/molecular link between the two remains incompletely understood.
Increased adipogenic programming in adipose tissue of IUGR infants has been reported in animal models previously.(7) For example, in a rat model, IUGR offspring born following 50% maternal food restriction (MFR) during the latter-half of pregnancy, nursed ad libitum postnatally, exhibited rapid catch-up growth, and developed obesity with increased body fat and plasma triglyceride levels in an age- and sex-dependent manner, being higher in males. The increased adiposity has been attributed to the “programmed” upregulation of the adipogenic transcription factor peroxisome proliferator-activated receptor γ (PPARγ).(8) Recently, Gong et al(9) studied bone marrow mesenchymal stem cells (BMSC) isolated from rat offspring subjected to global nutritional restriction during the latter-half of pregnancy and showed enhanced adipogenic but suppressed Wnt signaling profiles along with an increase in their proliferation potential. However, whether the white adipose tissue (WAT) progenitor cells, the main contributors to the obese phenotype, respond similar to BMSC, and whether this response is sex-specific and/or age-dependent is not known. To test this hypothesis, we used a well-established rat model of MFR during pregnancy that leads to adult obesity and metabolic syndrome.(9–13)
MATERIALS AND METHODS
The rat model of maternal food restriction during pregnancy
All studies were approved by the local Institutional Animal Care and Use Committee (IACUC) and were performed in accordance with the National Institutes of Health and IACUC guidelines.(10–12) Briefly, first-time pregnant Sprague Dawley rat dams were purchased from Charles River Laboratories Inc., Hollister, CA, USA, and were housed in the rat room which is maintained at 30-70% relative humidity and a temperature of 18-26°C, in a controlled 12 h light and 12 h dark cycle. At 10 days of gestation, the dams were provided either an ad libitum diet of standard laboratory rat chow (LabDiet 5001, Brentwood, MO, USA: protein 23%, fat 4.5%, metabolized energy 3,030 kcal/kg) or a 50% food-restricted diet, as determined by the quantification of the normal intake in the ad libitum fed rats. Following delivery, maternal food-restricted pups were fed ad libitum by foster dams. At PND1, the litters were separated by sex and the body weights of individual pups were recorded every other day till PND21. To minimize bias toward selecting either heavier or lighter pups, on PND1, all pups from each litter were weighed and 6 pups/litter (3 females and 3 males) closest to the median body weight (according to sex) were kept to maintain the same number of pups per dam between the control and MFR groups in the study; the remaining pups were culled.
Isolation of preadipocytes and cell culture
Pooled white adipose tissue from PND1 (6 pups/sex) and PND21 (3 pups/sex) was collected, and preadipocytes were isolated following previously described methods.(14) Briefly, male and female offspring were euthanized with pentobarbital overdose (200 mg/kg) and cervical dislocation at PND1 or PND21, and subcutaneous and retroperitoneal adipose tissue were collected. The sex of the animal was determined by examining the internal gonad or external genitalia on PND1 and PND21, respectively. Four pooled WAT from each group (PND1 control and MFR, and PND21 control and MFR) was minced, and digested with collagenase type II (5000 U/g) in Krebs-Ringer solution for 20 to 30 min at 37 °C, filtered through 100 μm cell strainer, then centrifuged at 500 x g for 5 minutes. The cells were re-suspended in DMEM/F12 Medium (Corning, New York, NY, USA) with 10% fetal bovine serum (FBS) (Corning, New York, NY, USA) and 1% Antibiotic-Antimycotics (GIBCO, Gaithersburg, MD, USA), seeded to T75 flasks and incubated at 37°C with 5% CO2. The media was changed every other day until cell confluence. Then the cells were sub-cultured onto 6-well plates and 2-well chamber slides till confluence. The preadipocytes were collected for RNA isolation and Oil Red O (ORO) staining, or were used for adipocyte induction. Three separate experiments (3 or 6 animals/sample for each sex; 4-pooled WAT samples/ group/experiment) were conducted in this study.
Adipocyte induction
For adipogenic induction, preadipocytes cultured in collagen pre-coated 6-well plates and 2-well cell culture chamber slides were treated with adipogenic induction media [DMEM/F12 medium plus 10% FBS, supplemented with 10 μM dexamethasone, 0.5 mM 3-isobutyl-1-methylxanthine, 10 μg/ml insulin, and 50 μM indomethacin (Sigma, St. Louis, MO, USA)] for 7–9 days. Following the adipocyte induction, the cells in 6-well plates were collected for RNA extraction; the adipocytes in chamber slides were assessed by ORO staining.
Oil Red O staining and quantification
The control (ad libitum) and MFR preadipocytes and adipocytes were fixed in 4% paraformaldehyde for 15 min and washed with 1× PBS. Three hundred microliter of ORO staining solution was added to the slides and kept for 20 to 30 min at room temperature. Following washing with distilled water, the slides were mounted with Vectashield Mounting Medium with DAPI (Vector Laboratories, Burlingame, CA, USA), and visualized under fluorescence microscopy. For quantification, preadipocytes and adipocytes stained with ORO were washed with distilled water 3 times, incubated with a fixed volume of isopropanol for 20 minutes to elute ORO, and then the absorbance was measured at 490 nm.
Flow cytometry of preadipocytes
Adherent preadipocytes cells were detached by trypsinization, washed with 1 x PBS and blocked with 3% FBS in PBS for 30 min at 4°C. Cells were aliquoted (100 μl/tube) for binding and staining with 2.5 μg/mL of FITC- or Alexa Fluor (AF)-conjugated antibodies. Sorting was performed using a BD Biosciences FACS DiVa High-Speed Cell Sorter (San Diego, CA, USA) with 350 nm, 488 nm, and 633 nm lasers. Anti-CD34 and anti-CD73 were conjugated to Alexa Fluor 488, anti-CD45 to FITC, anti-CD90 to PE, preadipocyte marker Pref-1 (Novus Biologicals, LLC. Centennial, CO, USA) and the appropriate isotype controls (all from BD Pharmingen Inc., San Diego, CA, USA). The analysis was performed on a FACS Aria III BD (Becton Dickinson, Franklin Lakes, NJ), and the data were analyzed using FlowJo software (Tree Star, San Carlos, CA). Propidium iodide was used to exclude dead cells, and percentages of positively stained-cells were calculated by subtracting the value of isotype controls. Cells were negatively selected for CD34 and CD45 and positively selected for CD73, CD90 binding, and Pref-1.
Pref-1 Protein detection by Simple Western Analysis (WES)
The Western blot analysis for Pref-1 protein detection was performed with an automated western-size based assay (ProteinSimple-WES; San Jose, CA, USA) following the company’s standard protocol. Five μg protein from each sample of PND1 preadipocytes and positive control 3T3-L1 preadipocytes (ATCC, Manassas, VA, USA) were loaded into 12-230KDa prefilled WES Separation plate (Protein Simple, San Jose, CA, USA). The protein separation is based on capillary-electrophoresis-SDS (CE-SDS). The protein identification was performed upon incubation with a primary Pref-1 antibody (Novus Biologicals, LLC. Centennial, CO, USA), and the subsequent blotting was done automatically by incubating and washing the capillary with secondary anti-rabbit antibody (Protein Simple, San Jose, CA, USA) conjugated with horseradish peroxidase and detected with chemiluminescence.
RNA isolation and quantitative real-time RT-PCR
Total RNA was isolated from cultured cells using Trizol Reagent (Invitrogen, Carlsbad, CA); the extracted RNA was quantitated by absorbance using a Nanodrop spectrophotometer (Nanodrop Instruments, Wilmington, DE) and processed for qRT-PCR according to our previously described methods.(10, 11, 13, 15) As described previously, all PCR primers were obtained from Sigma-Aldrich (St. Louis, MO, USA), which included cyclophilin: 5’-ACGCCGCTGTCTCTTTTC-3’ (forward) and 5’-GCAAACAGCTCGAAGCAGACGC-3’ (reverse); Pref-1 5’-TGTCATGGAGTCTGCAAGG-3’ (forward) and 5’-CAAGCCCGAACGTCTATTTC-3’ (reverse); Zfp423 5’-GTTGAAGAGGGGGAGGCCTC-3’ (forward) and 5’-GGCTGGATTTCCGATCACACTCTGAC-3’ (reverse); Adiponectin: 5’-CAAGCGCTCCTGTTCCTCTTAATCC-3’ (forward) and CTCCTGGCCCTTCGGTTGCA-3’ (reverse); C/EBPα: 5’-AGTTGACCAGTGACAATGACCG-3’ (forward) and 5’-TCAGGCAGCTGGCGGAAGAT-3’ (reverse); ADRP: 5’- ATTCTGGACCGTGCCGATT −3’ (forward) and 5’- CTGCTACTGATGCCATTTTTCCT −3’ (reverse); PPARγ: 5’- CCAAGTGACTCTGCTCAAGTATGG −3’ (forward) and 5’- CATGAATCCTTGTCCCTCTGATATG −3’ (reverse); Androgen Receptor: 5’-AGGTAGCTCTGGGACACTTGAGAT-3’ (forward) and 5’-AGAGCGAGCGGAAAGTTGTAGT-3’ (reverse); and Estrogen Receptor 1: 5’-ACCAATGCACCATCGATAAGAA-3’ (forward) and 5’-TCTTTTCGTATCCCGCCTTTC-3’ (reverse). All real-time PCRs were performed in triplicate on an ABI StepOnePlus System (Applied Biosystems, Foster City, CA, USA). The relative mRNA levels were calculated using the 2−ΔΔCT method, with cyclophilin as a normalizer.
Rat adipogenic RT-PCR array
A rat adipogenesis-specific RT-PCR array (QIAGEN Inc. Germantown, MD, USA) was also performed. This assay provides information for 84 specific genes involved in the adipogenesis pathway. The probed genes were grouped as PPARγ targets, pro- and anti-adipogenesis markers, and pro-brown adipose tissue (BAT) markers.
Serum sex hormones
Since sex hormones (estrogens and androgens) can influence the developmental adipocyte programming, (16, 17) we determined blood estradiol and testosterone levels. Blood samples were collected via cardiac puncture in serum collection tubes at PND1 and PND21, and serum testosterone and estradiol levels were determined using commercial ELISA kits (ALPCO, Salem, NH, USA).
Statistical Analysis
The data were analyzed using either ANOVA or student’s t-test, as appropriate. The results are based on 3 independent experiments (4 pooled WAT samples/experiment) and the values are expressed as mean ± SEM. A p-value of < 0.05 is considered to represent a statistically significant difference between the experimental groups
RESULTS
Effect of maternal food restriction on offspring body weight from PND1 to PND21
Offspring body weight was recorded every other day. On PND1, all pups from each litter were weighed (MFR male = 5.1 ± 0.67 g and female = 5.2 ± 0.83 g vs Control male = 6.8 ± 0.58 g and female 7.1 ± 0.51 g; p<0.001), which indicated significantly lower body weight of both sexes in the MFR group at birth (Figure 1). In line with our previous reports, on PND21, the MFR pups (male = 47.2 ± 1.70 g and female = 45.1 ±1.73) still had significantly lower body weights vs. control pups (male = 52.4 ±2.43 g and female = 48.3 ± 2.13 g; p<0.001). (9, 12)
FIGURE 1. Effect of maternal food restriction on offspring body weight from postnatal day 1 to postnatal day 21.
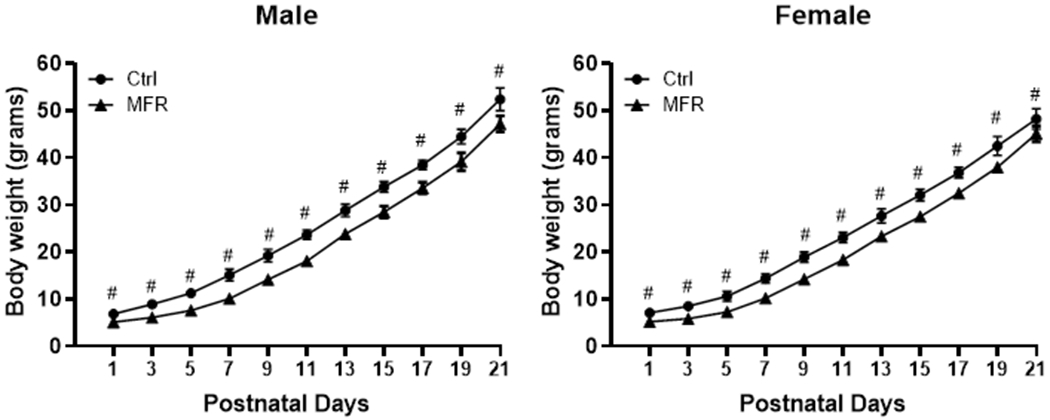
Both male and female MFR pups had significantly lower body weights vs. controls at postnatal days 1 and 21 (#p<0.001 vs controls).
Characterization of preadipocytes
PND1 and PND21 preadipocytes isolated and subjected to FACS were negative for CD34 and CD45 (> 97%) and positive for CD73 and CD90 (> 97%); however, only 35-40% stained positive for Pref-1, a specific preadipocyte marker (Figure 2). Nevertheless, western blotting provided clear evidence for the abundant positivity for Pref-1, similar to that seen in 3T3-L1 cells, a standard preadipocyte cell line (Figure 2), indicating technical reasons for the ineffectiveness of FACS analysis in detecting Pref-1 by the antibody used. Taken together, these FACS data confirm the preadipocyte nature of isolated cells.
FIGURE 2. Cell characterization by flow cytometry.
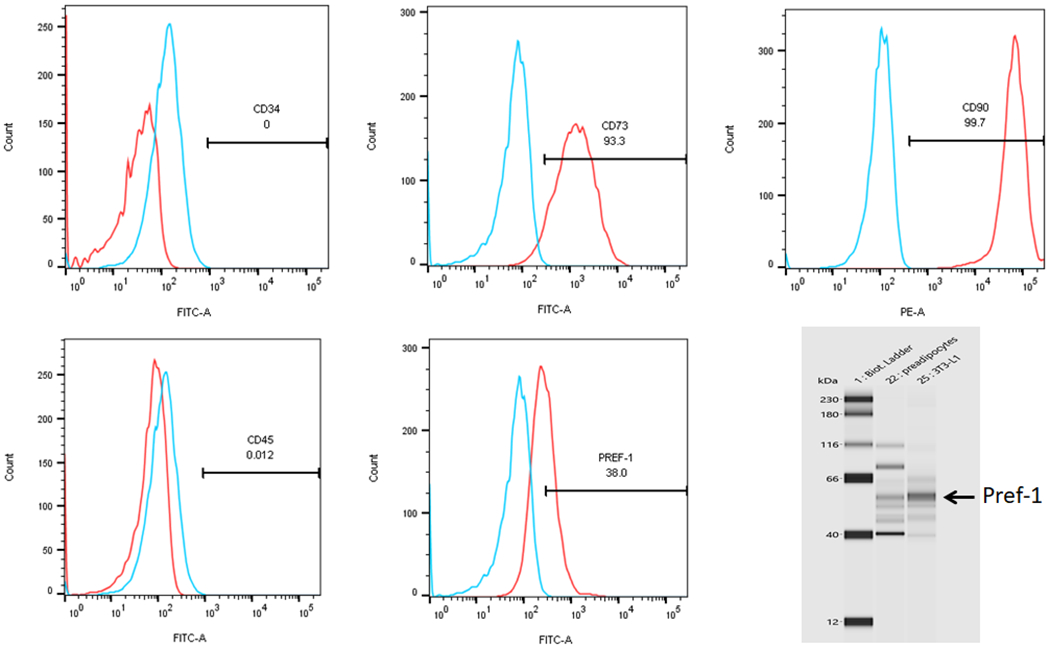
The isolated adipocyte progenitors, as characterized by flow cytometry, were negatively selected for CD34 and CD45, and positively selected for CD73 and CD90. Pref-1, a specific preadipocyte marker, was positive in only 40% of the cells. However, Western analysis showed abundant Pref-1 positivity indicating technical reasons for flow cytometry to not adequately identify these cells as Pref-1 positive (N=3).
Effect of maternal food restriction on key adipogenic mRNA markers
On PND1, key adipogenic programming genes, PPARγ (Figure 3A), and Pref-1 (Figure 3B) were downregulated in preadipocytes isolated from both MFR males and females (p<0.05 vs controls), when analyzed together, as well as when analyzed in a sex-specific manner. However, at PND21, although preadipocytes from MFR females continued to show downregulation of PPARγ and Pref-1 expression, male MFR preadipocytes showed upregulation in the expression of these genes (p<0.05 vs. controls). However, zfp423, a key transcriptional regulator of adipogenic programming, was decreased in preadipocytes isolated from MFR males and females at both PND1 and PND21 (Figure 3C). In line with these data, adipocytes, i.e., the cells resulting after the adipogenic induction of preadipocytes, of both male and female offspring at PND1 exhibited diminished PPARγ, ADRP, adiponectin, and C/EBPα levels (p<0.01 vs controls). Furthermore, at PND21, although adipocytes from MFR females continued to show lower PPARγ, ADRP, adiponectin, and C/EBPα (p<0.05 vs controls) levels, adipocytes from MFR males showed an upward trend in the expression of PPARγ, ADRP, and adiponectin (Figure 4).
FIGURE 3. Effect of maternal food restriction on mRNA profiling of preadipocytes.
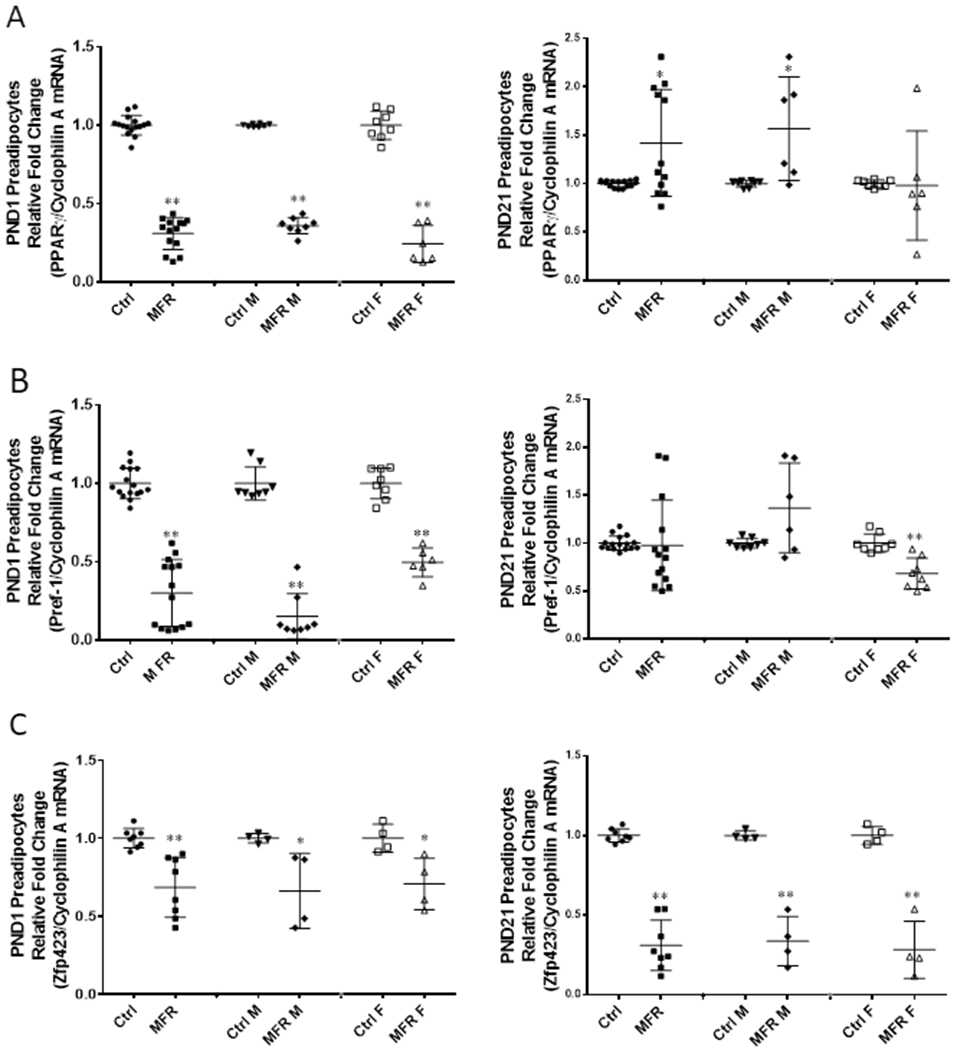
On PND1, the combined data showed decreased expression of PPARγ (A), Pref-1 (B) and Zfp423 (C) in the MFR group. When stratified by sex, both MFR male (MFR M) and MFR female (MFR F) cells showed downregulation of these 3 genes as well. At PND21, compared with the control group, MFR group showed increased PPARγ, but similar Pref-1 and still reduced Zfp423 expression. When stratified by sex, MFR M group showed upregulation of PPARγ and Pref-1, but continued decreased expression of Zfp423. In contrast, MFR F group continued to show decreased expression of all 3 genes (PPARγ, Pref-1, and Zfp423) (N=4–12, *p<0.05, ** p<0.01 vs controls).
FIGURE 4. Effect of maternal food restriction on mRNA profiling of adipocytes.
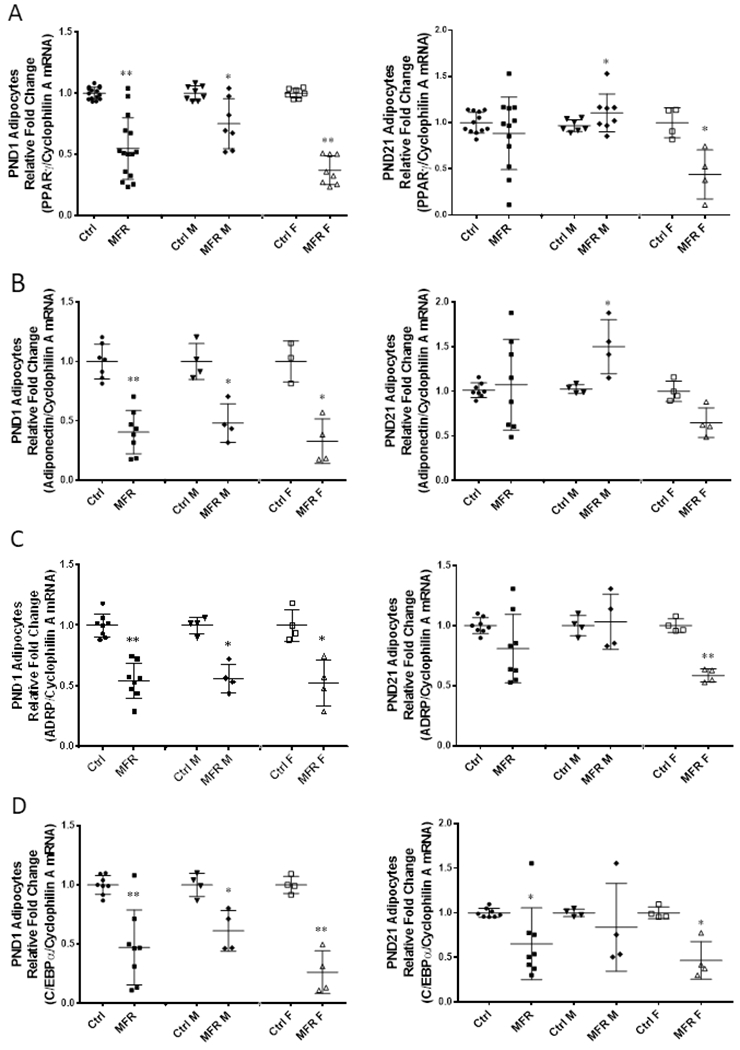
On PND1, the combined data showed decreased expression of PPARγ (A), Adiponectin (B), ADRP (C) and C/EBPα (D) in maternal food restricted group (MFR). When stratified by sex, MFR male (MFR M) and MFR female (MFR F) showed downregulation of these adipogenic markers as well. On PND21, the combined data showed no significant change in PPARγ, Adiponectin and ADRP expression, but still a significant decrease in C/EBPα expression in the MFR vs. the control group. When stratified by sex, the MFR M group showed a significant upregulation in PPARγ and Adiponectin expression with no change in ADRP and a decreased expression in C/EBPα. In contrast, the MFR F group continued to show significant downregulation in the expression of PPARγ, ADRP, and C/EBPα (N=4-12, *p<0.05, ** p<0.01 vs controls).
Effect of maternal food restriction on mRNA expression using an adipogenesis pathway-focused RT-PCR array
To obtain more detailed information on the effect of MFR on adipogenesis programming, an adipogenesis pathway-focused gene expression RT-PCR array was performed on control and MFR male and female PND21 adipocytes. Using a 2-fold change cut-off, compared to controls, 18 genes showed a significant change. As shown in Figure 5, in general, the expression of PPARγ and its downstream adipogenesis promoting genes was increased in MFR male adipocytes, in particular cfd, retn genes, which increased 2- and 2.4-fold, respectively. Pro-adipogenesis markers cebpβ and fos were increased ≥4-fold in MFR male adipocytes. Anti-adipogenesis markers jun, ccnd1, gata2 were significantly elevated in MFR female adipocytes by 3.7-fold, 5.1-fold, and 4.5- fold, respectively. Pro-brown adipose tissue markers particularly dio2 and wnt 5a were more than 15-fold increased in MFR female adipocytes. Overall, the expression of these genes indicates that compared to female MFR adipocytes, male MFR adipocytes are programmed to exhibit stronger adipogenic propensity.
FIGURE 5. Adipogenesis Real-time RT-PCR array.
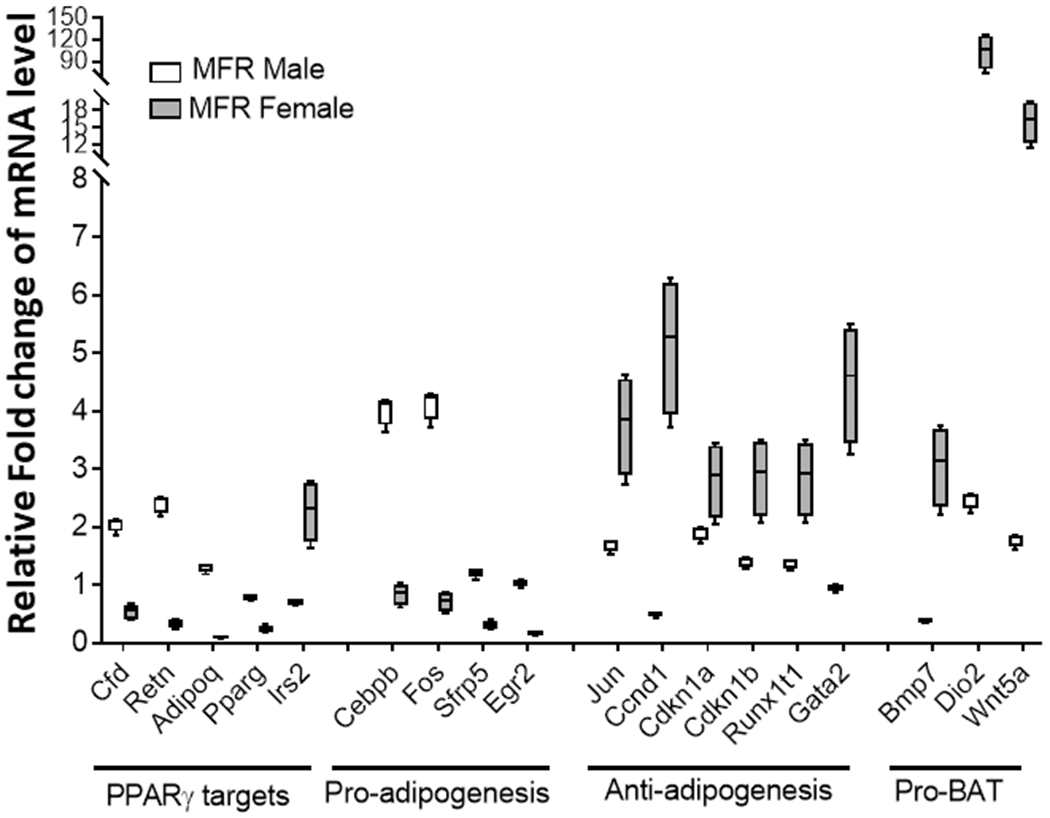
The expression of PPARγ downstream target genes promoting adipogenesis was increased in MFR male adipocytes. Pro-adipogenesis markers c/ebpβ and fos had increased expression in MFR male adipocytes. Anti-adipogenesis markers, in particular, jun, ccnd1, and gata2, were significantly elevated in MFR female adipocytes. Pro-BAT markers particularly Dio2 and Wnt 5a were more than 15-fold increased in MFR female adipocytes (N=4, p<0.01 for all).
ORO staining and quantification
Male MFR preadipocytes showed significantly higher lipid content in both PND1 and PND21, as determined by ORO staining and measured objectively by absorbance of eluted ORO at 490 nm, compared to controls, whereas female PND1 and PND21 MFR preadipocytes were not different from the controls. Compared to controls, while both PND1 and PND21 female MFR adipocytes exhibited decreased ORO staining, only PND1 male adipocytes exhibited decreased ORO staining (Figure 6).
FIGURE 6. Oil Red O Staining.
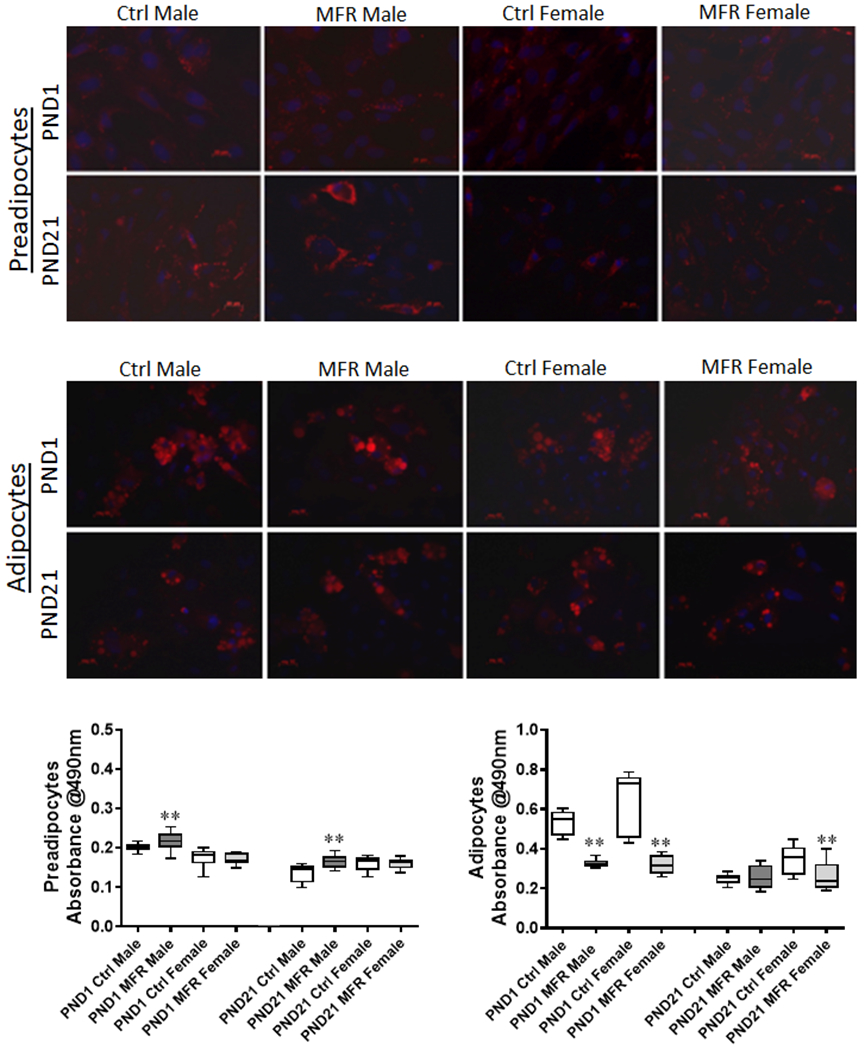
Oil Red O staining of postnatal day (PND) 1 and 21 male and female MFR and control preadipocytes and adipocytes is shown in the upper panels, with the objective measurement of the ORO content, as determined by measurement of absorbance at 490 nm of the eluted ORO, in the lower panel. In preadipocytes, MFR male group at PND 1 and PND 21 showed increased absorbance compared to controls (**p<0.01 vs controls). In adipocytes at PND 1, MFR male and female cells showed decreased absorbance; however, at PND21, only MFR females showed decreased absorbance (data from 3 separate experiments).
Effect of maternal food restriction on offspring serum sex hormones and adipocyte estrogen receptor 1 and androgen receptor expression
At PND1, there was no effect of food restriction on serum estradiol levels in both males and females; however, at PND21, compared to controls, serum estradiol level was lower in males but higher in females (Figure 7A). Regarding testosterone levels, compared to controls, the serum testosterone level was higher in males at PND1, but not different in females at PND1 and in both males and females at PND21 (Figure 7B). Furthermore, compared to controls, estrogen receptor 1 expression was lower in adipocytes from both males and females at PND 1 and 21 (Figure 7C), while androgen receptor expression was lower in adipocytes from PND 1 and 21 males with no effect of food restriction on androgen receptor expression in adipocytes from females at both PND 1 and 21 (Figure 7D).
FIGURE 7. Effect of maternal food restriction on serum sex hormones and adipocyte estrogen receptor 1 and androgen receptor mRNA expression.
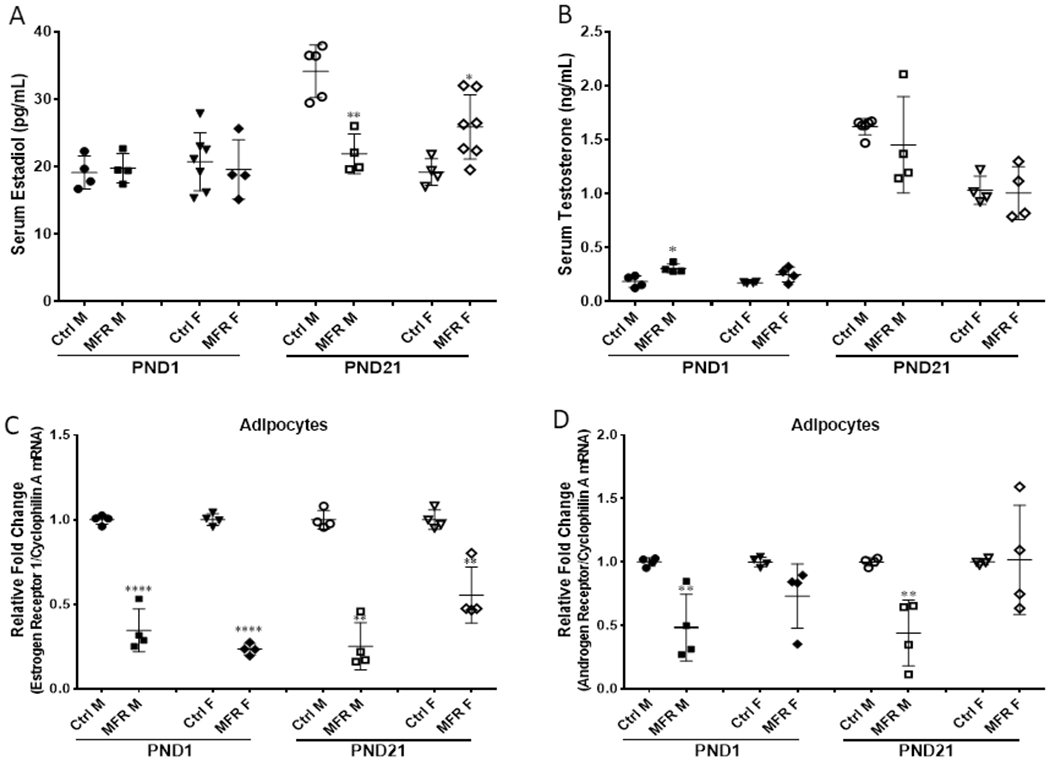
There was no differences on serum estradiol levels in both males and females at PND1 compared to controls; there was decreased significantly in males but increased in females at PND 21 (A). The serum testosterone level was higher in males at PND1, but no effect in females at PND 1 and in both at PND 21 (B). Estrogen receptor 1 mRNA expression was decreased in adipocyte in both males and females at PND 1 and 21 (C). Androgen receptor mRNA expression was decreased significantly in male adipocytes at PND 1 and 21, but no effect on female adipocytes at PND 1 and 21 (D). (N=4-7, *p<0.05; **p<0.01; ****p<0.001 vs. controls)
DISCUSSION
In this study, preadipocytes were initially characterized using flow cytometry with negative staining for CD34 and CD45 and positive staining for CD73 and CD90 (Figure 2). The key adipogenic markers PPARγ and Pref-1 were downregulated in MFR PND1 preadipocytes (MFR vs control group) and up-regulated in PND21 preadipocytes (MFR vs control group). When stratified by sex, at PND1, both male and female MFR preadipocytes showed significant down regulation of key adipogenic markers, whereas, at PND21, compared to controls, male MFR preadipocytes showed significantly enhanced expression of PPARγ and Pref-1, whereas female MFR preadipocytes continued to show downregulation of these genes (Figures 3A and 3B).
Similar to the preadipocyte mRNA profiling, PPARγ, ADRP, and adiponectin expression was downregulated in MFR PND1 adipocytes in both males and females. On PND21, PPARγ and adiponectin expression was increased in MFR males but reduced in MFR females (Figure 4A and 4B). However, these changes were not accompanied by similar changes in CEBPα and ADRP (Figures 4C and 4D). On ORO staining, male MFR preadipocytes at PND1 and PND21 showed increased adsorbance compared to controls. At PND1, both male and female MFR adipocytes showed decreased adsorbance, whereas, at PND21 only female MFR adipocytes showed decreased adsorbance supporting the proposed hypothesis that IUGR males vs. females demonstrate relatively increased propensity for adiposity (Figure 6).
Furthermore, we performed adipogenesis-focused RT-PCR array with 84 different genes grouped into four categories - PPARγ targets, pro-adipogenesis markers, anti-adipogenesis markers, and pro-BAT markers (Figure 5). PPARγ targets i.e., cfd (regulates insulin secretion) and retn (directly linked to obesity and type II diabetes) were increased by ≥2-fold (compared to controls, p<0.01). Interestingly, of the PPARγ targets examined, irs 2 (insulin receptor substrate 2), which mediates the effect of Insulin and IGF-1, was the only mRNA that increased in female adipocytes. Lack of this gene is known to have a diabetic phenotype, and its expression is protective against obesity. Among the pro-adipogenesis genes, there was a ≥ 4-fold increased expression of c/ebpβ (potentiates expression of PPARγ) and Fos (modulates adipocyte differentiation). In line with the rest of our data, anti-adipogenesis markers, in particular, gata2 (a transcription factor whose down-regulation early in adipogenesis is required for preadipocyte differentiation) and Ccnd 1 (inhibitor of PPARγ) were ≥4-fold increased in MFR female adipocytes. Additionally, another anti-adipogenic marker Runx1 (responsible for osteogenic differentiation) was more than 3-fold increased in female MFR adipocytes. Pro-BAT markers were more than 15-fold increased in MFR female adipocytes. Overall, the adipogenic-focused mRNA expression pattern indicates male MFR adipocytes were programmed to exhibit more adipogenic profile, whereas female MFR adipocytes were more prone to accumulate BAT, thus supporting our overall hypothesis.
Adipocytes express both estrogen receptor 1 and androgen receptor. Estrogen receptor 1 mediates the adipogenic effect of estrogen on adipocytes although this effect is species-, sex-, and fat depot (visceral vs. subcutaneous)-dependent.(16) The androgen receptor mediates testosterone’s inhibitory effect on adipogenesis. However, the effects of estrogen and testosterone on adipocytes are highly complex, since in addition to adipocyte differentiation the sex hormones also modulate lipolysis, lipogenesis, insulin sensitivity, and the secretion of various cytokines by adipocytes. To gain insight into the possible role of sex hormones in sex-specific adipogenic programming in IUGR offspring, we determined serum estradiol and testosterone levels as well as estrogen receptor 1 and androgen receptor expression by PND 1 and 21 adipocytes from various experimental groups. Interestingly, differential effects of food restriction during pregnancy on androgen receptor and serum estradiol and testosterone levels occurred. Increased serum testosterone at PND1 coupled with decreased androgen receptor expression in PND21 in IUGR male offspring possibly alters the estradiol-testosterone balance potentially predisposing to enhanced adipogenic programming in males. However, this paradigm needs to be further tested and validity in future mechanistic studies.
In mammals, fat is typically classified by morphological appearance as being either white or brown adipose tissue (WAT or BAT). WAT is the primary site of energy storage and is often classified as being visceral or subcutaneous. Although the primary function of WAT is energy storage, it also functions as an endocrine organ secreting hormones and cytokines such as leptin and adiponectin that regulate feeding and metabolism.(18) Accumulation of visceral WAT is associated with metabolic disease (i.e. insulin resistance, type 2 diabetes, dyslipidemia, hypertension, atherosclerosis, hepatic steatosis, and cancer.(19–21) In contrast, the BAT is specialized to expend energy to generate heat, i.e., adaptive thermogenesis and it does not result in obesity.
Though extensively researched, the molecular mechanisms leading to obesity and metabolic phenotype remain poorly understood. It is conceivable that an individual’s obesogenic molecular profile plays an important contributory role. Differentiation of preadipocytes to adipocytes involves a comprehensive molecular network including transcription factors responsible for the expression of key proteins that induce mature adipocyte formation. In mammals, both BAT and WAT develop from mesenchymal stem cells (MSC), guided by a delicate balance between PPARγ and wnt signaling. PPARγ is the master switch dictating MSC differentiation to WAT progenitors/preadipocytes.(22–26)
The early life environment experienced by an individual in utero and during the early postnatal period is now recognized as a significant factor in shaping later life disease risk, including susceptibility to develop obesity. This lines up with the concept of “fetal origins of adult conditions”. Of note, birth weight at both ends of the spectrum, i.e., low birth weight or excessive birth weight, is associated with later obesity and the metabolic phenotype, leading to a paradox for predisposition to these conditions.(27, 28) Furthermore, sex-specific changes remain a challenge to study due to overlapping hormonal factors that come into play.
There are potential limitations to this study. For example, maternal food restriction, the model used in this study, is only one of the many causes of IUGR;(29) therefore, our data may not be generalizable to IUGR that is not due to nutrient insufficiency. However, it is important to point out that globally, of the approximately 30 million infants born growth restricted each year, 75% are born in Asia,(30) where the primary cause for IUGR is maternal undernutrition.(31) In contrast, the rate of IUGR in developed countries is about 1/6th of that seen in underdeveloped countries with the predominant cause being placental insufficiency during the 3rd trimester.(32) Therefore, although the model used in this study may not reflect the most common cause of IUGR in developed countries, it mimics the scenario that more commonly leads to IUGR worldwide. Furthermore, in the model used, although the bodyweight of IUGR offspring lagged compared to that of control offspring at PND21, these offspring develop obesity in adulthood similar to what is seen in human IUGR infants. It may be worth noting that in human IUGR infants most catch-up growth occurs from 6 months to 2 years, i.e., after initially lagging behind the growth of appropriate for gestational age infants.(33) Moreover, it is likely that in the model used, PND21 might be too early to fully elicit the evolving adipogenic programming. However, changes in the adipogenic programming noted between PND1 and PND21 emphasize the importance of the postnatal diet as a strong determinant of offspring obesity. This is particularly relevant since the rapidity of postnatal catch-up growth markedly increases the risk of developing adult obesity and metabolic syndrome.(34, 35) Besides, it is also important to note that our data reflect the effects of prenatal MFR-induced programming, coupled with ad lib feeding postnatally. It would be interesting to see the impact of continued postnatal food restriction. Collectively, our study shows that in addition to a number of the previously identified hormonal and molecular factors, including transcription factors, miRNAs, and epigenetic mechanisms that determine catch-up growth, sex-specific adipogenic programming is an additional determinant in developing the obese phenotype in the affected offspring.
In summary, preadipocytes isolated from rat offspring subjected to global nutritional restriction during the latter-half of pregnancy, at PND21, showed enhanced adipogenic potential selectively in males. These data are further supported by RT-PCR array showing enhanced expression of PPARγ targets and pro-adipogenesis markers in male MFR adipocytes, with >15 fold increased expression of pro-BAT markers in female MFR adipocytes. Additionally, food restriction during pregnancy elicits differential sex hormonal and receptor expression on adipocytes. Our data, while also highlighting the importance of the postnatal diet, show sex-differential programming for later overweight/obesity following prenatal nutrition restriction. Taken together, the molecular and functional profile of MFR adipocytes suggests a novel cellular/mechanistic link between intrauterine nutritional stress and later offspring obesity and offers sex-specific potential targets against IUGR offspring overweight/obesity phenotype.
ACKNOWLEDGEMENTS
This research was funded by grants from the NIH (HD058948, HL107118, HD071731, HD127237, HL151769, and HL152915) and the TRDRP (23RT-0018, 27IP-0050, and T29IR0737). The funders had no role in study design, data collection and analysis, decision to publish, or preparation of the manuscript. The authors had full access to all of the data and take responsibility for the integrity of the data and the accuracy of the analysis.
Abbreviations
- IUGR
intrauterine growth restriction
- MFR
maternal food restriction
- WAT
white adipose tissue
- PND
postnatal day
- PPARγ
peroxisome proliferator-activated receptor γ
- ADRP
adipose differentiation-related protein
- ORO
Oil Red O
- BMSC
bone marrow mesenchymal stem cells
- BAT
brown adipose tissue
- C/EBPα
CCAAT-enhancer-binding protein α
- CE-SDS
capillary-electrophoresis-SDS
- MSC
mesenchymal stem cells
Footnotes
CONFLICT OF INTEREST: The authors declare that they have no conflict of interest.
REFERENCES
- 1.Flegal KM, Kruszon-Moran D, Carroll MD, Fryar CD, and Ogden CL (2016) Trends in Obesity Among Adults in the United States, 2005 to 2014. Jama 315, 2284–2291 [DOI] [PMC free article] [PubMed] [Google Scholar]
- 2.Garver WS, Newman SB, Gonzales-Pacheco DM, et al. (2013) The genetics of childhood obesity and interaction with dietary macronutrients. Genes Nutr 8, 271–287 [DOI] [PMC free article] [PubMed] [Google Scholar]
- 3.Harding JE (2001) The nutritional basis of the fetal origins of adult disease. Int J Epidemiol 30, 15–23 [DOI] [PubMed] [Google Scholar]
- 4.Barker DJ, and Osmond C (1986) Infant mortality, childhood nutrition, and ischaemic heart disease in England and Wales. Lancet 1, 1077–1081 [DOI] [PubMed] [Google Scholar]
- 5.Hales CN, and Barker DJ (1992) Type 2 (non-insulin-dependent) diabetes mellitus: the thrifty phenotype hypothesis. Diabetologia 35, 595–601 [DOI] [PubMed] [Google Scholar]
- 6.Tarantal AF, and Berglund L (2014) Obesity and lifespan health--importance of the fetal environment. Nutrients 6, 1725–1736 [DOI] [PMC free article] [PubMed] [Google Scholar]
- 7.Martin RJ, Hausman GJ, and Hausman DB (1998) Regulation of adipose cell development in utero. Proc Soc Exp Biol Med 219, 200–210 [DOI] [PubMed] [Google Scholar]
- 8.Desai M, Guang H, Ferelli M, Kallichanda N, and Lane RH (2008) Programmed upregulation of adipogenic transcription factors in intrauterine growth-restricted offspring. Reprod Sci 15, 785–796 [DOI] [PMC free article] [PubMed] [Google Scholar]
- 9.Gong M, Antony S, Sakurai R, et al. (2016) Bone marrow mesenchymal stem cells of the intrauterine growth-restricted rat offspring exhibit enhanced adipogenic phenotype. Int J Obes (Lond) 40, 1768–1775 [DOI] [PMC free article] [PubMed] [Google Scholar]
- 10.Desai M, Gayle D, Babu J, and Ross MG (2005) Programmed obesity in intrauterine growth-restricted newborns: modulation by newborn nutrition. Am J Physiol Regul Integr Comp Physiol 288, R91–96 [DOI] [PubMed] [Google Scholar]
- 11.Karadag A, Sakurai R, Wang Y, et al. (2009) Effect of maternal food restriction on fetal rat lung lipid differentiation program. Pediatr Pulmonol 44, 635–644 [DOI] [PMC free article] [PubMed] [Google Scholar]
- 12.Paek DS, Sakurai R, Saraswat A, et al. (2015) Metyrapone alleviates deleterious effects of maternal food restriction on lung development and growth of rat offspring. Reprod Sci 22, 207–222 [DOI] [PMC free article] [PubMed] [Google Scholar]
- 13.Rehan VK, Li Y, Corral J, et al. (2014) Metyrapone blocks maternal food restriction-induced changes in female rat offspring lung development. Reprod Sci 21, 517–525 [DOI] [PMC free article] [PubMed] [Google Scholar]
- 14.Yee JK, Lee WN, Ross MG, et al. (2012) Peroxisome proliferator-activated receptor gamma modulation and lipogenic response in adipocytes of small-for-gestational age offspring. Nutr Metab (Lond) 9, 62. [DOI] [PMC free article] [PubMed] [Google Scholar]
- 15.Desai M, Gayle D, Babu J, and Ross MG (2007) The timing of nutrient restriction during rat pregnancy/lactation alters metabolic syndrome phenotype. Am J Obstet Gynecol 196, 555.e551–557 [DOI] [PMC free article] [PubMed] [Google Scholar]
- 16.Newell-Fugate AE (2017) The role of sex steroids in white adipose tissue adipocyte function. Reproduction (Cambridge, England) 153, R133–r149 [DOI] [PubMed] [Google Scholar]
- 17.Puttabyatappa M, Lu C, Martin JD, et al. (2018) Developmental Programming: Impact of Prenatal Testosterone Excess on Steroidal Machinery and Cell Differentiation Markers in Visceral Adipocytes of Female Sheep. Reprod Sci 25, 1010–1023 [DOI] [PMC free article] [PubMed] [Google Scholar]
- 18.Cristancho AG, and Lazar MA (2011) Forming functional fat: a growing understanding of adipocyte differentiation. Nat Rev Mol Cell Biol 12, 722–734 [DOI] [PMC free article] [PubMed] [Google Scholar]
- 19.Misra A, Garg A, Abate N, et al. (1997) Relationship of anterior and posterior subcutaneous abdominal fat to insulin sensitivity in nondiabetic men. Obes Res 5, 93–99 [DOI] [PubMed] [Google Scholar]
- 20.Pischon T, Boeing H, Hoffmann K, et al. (2008) General and abdominal adiposity and risk of death in Europe. N Engl J Med 359, 2105–2120 [DOI] [PubMed] [Google Scholar]
- 21.Zhang C, Rexrode KM, van Dam RM, Li TY, and Hu FB (2008) Abdominal obesity and the risk of all-cause, cardiovascular, and cancer mortality: sixteen years of follow-up in US women. Circulation 117, 1658–1667 [DOI] [PubMed] [Google Scholar]
- 22.Barak Y, Nelson MC, Ong ES, et al. (1999) PPAR gamma is required for placental, cardiac, and adipose tissue development. Mol Cell 4, 585–595 [DOI] [PubMed] [Google Scholar]
- 23.Rosen ED, Sarraf P, Troy AE, et al. (1999) PPAR gamma is required for the differentiation of adipose tissue in vivo and in vitro. Mol Cell 4, 611–617 [DOI] [PubMed] [Google Scholar]
- 24.Rosen ED, Walkey CJ, Puigserver P, and Spiegelman BM (2000) Transcriptional regulation of adipogenesis. Genes Dev 14, 1293–1307 [PubMed] [Google Scholar]
- 25.Ross SE, Erickson RL, Gerin I, et al. (2002) Microarray analyses during adipogenesis: understanding the effects of Wnt signaling on adipogenesis and the roles of liver X receptor alpha in adipocyte metabolism. Mol Cell Biol 22, 5989–5999 [DOI] [PMC free article] [PubMed] [Google Scholar]
- 26.Tontonoz P, Hu E, and Spiegelman BM (1995) Regulation of adipocyte gene expression and differentiation by peroxisome proliferator activated receptor gamma. Curr Opin Genet Dev 5, 571–576 [DOI] [PubMed] [Google Scholar]
- 27.Boney CM, Verma A, Tucker R, and Vohr BR (2005) Metabolic syndrome in childhood: association with birth weight, maternal obesity, and gestational diabetes mellitus. Pediatrics 115, e290–296 [DOI] [PubMed] [Google Scholar]
- 28.Cnattingius S, Villamor E, Lagerros YT, Wikstrom AK, and Granath F (2012) High birth weight and obesity--a vicious circle across generations. Int J Obes (Lond) 36, 1320–1324 [DOI] [PubMed] [Google Scholar]
- 29.Malhotra A, Allison BJ, Castillo-Melendez M, et al. (2019) Neonatal Morbidities of Fetal Growth Restriction: Pathophysiology and Impact. Frontiers in endocrinology 10, 55. [DOI] [PMC free article] [PubMed] [Google Scholar]
- 30.de Onis M, Blössner M, and Villar J (1998) Levels and patterns of intrauterine growth retardation in developing countries. European journal of clinical nutrition 52 Suppl 1, S5–15 [PubMed] [Google Scholar]
- 31.Lee AC, Katz J, Blencowe H, et al. (2013) National and regional estimates of term and preterm babies born small for gestational age in 138 low-income and middle-income countries in 2010. The Lancet. Global health 1, e26–36 [DOI] [PMC free article] [PubMed] [Google Scholar]
- 32.Imdad A, Yakoob MY, Siddiqui S, and Bhutta ZA (2011) Screening and triage of intrauterine growth restriction (IUGR) in general population and high risk pregnancies: a systematic review with a focus on reduction of IUGR related stillbirths. BMC public health 11 Suppl 3, S1. [DOI] [PMC free article] [PubMed] [Google Scholar]
- 33.Hokken-Koelega AC, De Ridder MA, Lemmen RJ, et al. (1995) Children born small for gestational age: do they catch up? Pediatric research 38, 267–271 [DOI] [PubMed] [Google Scholar]
- 34.Nobili V, Alisi A, Panera N, and Agostoni C (2008) Low birth weight and catch-up-growth associated with metabolic syndrome: a ten year systematic review. Pediatr Endocrinol Rev 6, 241–247 [PubMed] [Google Scholar]
- 35.Ong KK, Ahmed ML, Emmett PM, Preece MA, and Dunger DB (2000) Association between postnatal catch-up growth and obesity in childhood: prospective cohort study. Bmj 320, 967–971 [DOI] [PMC free article] [PubMed] [Google Scholar]


