
Fig. 3.
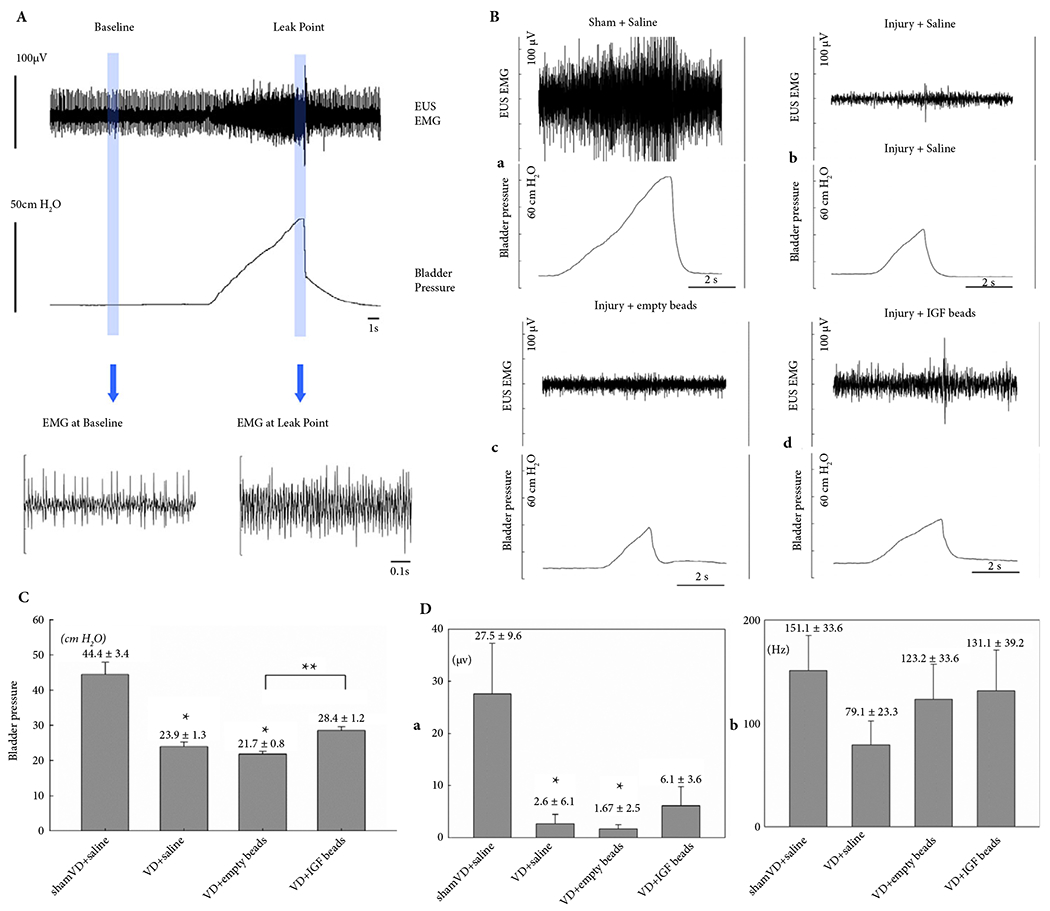
(A) Representative examples of LPP and EUS EMG data from a sham-VD rat. The slow rise to peak in bladder pressure is from external pressure applied to the bladder. When leakage occurs, the external pressure is rapidly removed and the pressure quickly drops back to baseline. The vertical lines indicate the 1-s segments used for quantitative data analysis. (B) Representative examples of EUS EMG and LPP results at 1 week after (a) sham-VD treated with saline, (b) VD treated with saline, (c) VD treated with empty microbeads, and (d) VD treated with IGF-1 loaded microbeads. (C) LPP results. Each bar represents mean ± sem of data from 11 rats. *Indicates a significant difference compared with the sham-VD + saline group with P < 0.05. **Indicates a significant difference compared with the VD + empty beads group with P < 0.05. (D) EUS EMG results. (a) Amplitude increase and (b) firing rate increase are shown as mean ± sem of data from 11 rats. *Indicates a significant difference compared with the sham-VD + saline group with P < 0.05.