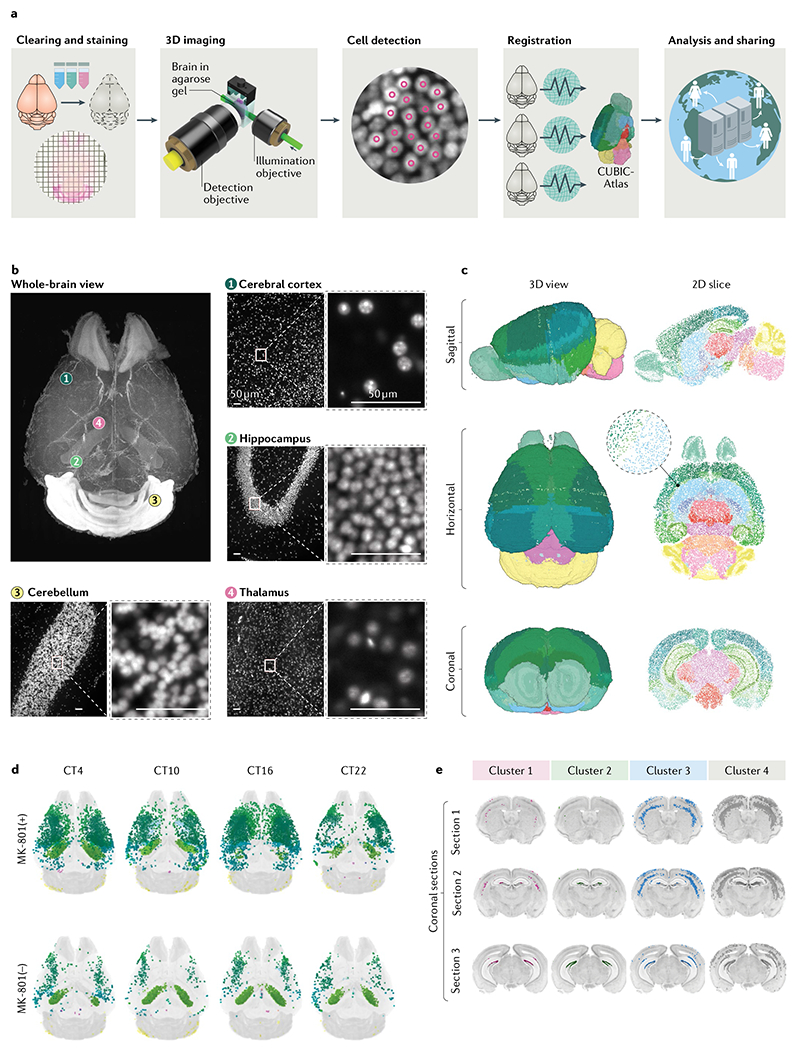
Fig. 2 |. Whole-brain single-cell-resolution imaging and analysis.

a | Tissue-clearing methods allow whole-brain profiling of cells. The brain data obtained can be registered in the 3D single-cell-resolution mouse brain atlas (CUBIC-Atlas) and shared by a worldwide research community via the Internet17. First, tissue clearing (and fluorescent staining if applicable) is applied to the specimen. Cleared brains are imaged using high-resolution light-sheet microscopy. A graphics processing unit-based high-speed cell counting program identifies all cells from the acquired images, rendering the whole tissue into an ensemble of cellular points (that is, a point cloud). Then, individual brains are registered onto the common brain coordinates to allow guantitative comparison and analysis. Finally, these data should be shared among researchers to allow collaborative and large-scale analysis. b | Images of an adult mouse brain obtained by the hydrophilic tissue-clearing and expansion protocol CUBIC-X and custom-made high-resolution light-sheet microscopy17. Nuclear staining using propidium iodide was applied to the cleared brain tissue. Magnified views of some of the representative brain regions, including cerebral cortex (view 1), hippocampus (view 2), cerebellum (view 3) and thalamus (view 4), are presented, along with the whole-brain overview. Scale bars indicate 50 μm after normalization of the sample expansion. c | The 3D single-cell-resolution mouse brain atlas CUBIC-Atlas. With use of nuclear staining images such as the ones shown in part b, all cell nuclei in a whole mouse brain were identified, totalling ~108 cells17,66. The colour of each cell represents anatomical annotations of each brain region obtained from the Allen Brain Atlas. d | The whole-brain neuronal activity profile with or without the long-term administration of a NMDA receptor inhibitor (MK-801) was quantified by imaging the destabilized fluorescent protein dVenus under the control of the Arc gene promoter by using the Arc–dVenus transgenic mouse53. Each Arc–dVenus mouse brain at different circadian times (CT) was mapped onto CUBIC-Atlas in a probabilistic manner to virtually reconstruct the time series17. Arc–dVenus-expressing cells are shown as dots, with their colours representing their anatomical areas. e | By clustering analysis of the data shown in part d, four distinct populations of cells were identified, exhibiting different activity patterns on MK-801 administration. Localization of each cluster is shown in coronal sections, revealing an inhomogeneous cellular population in the lower and upper dentate gyrus. Parts b–e were adapted from REF.17, Springer Nature Limited.
