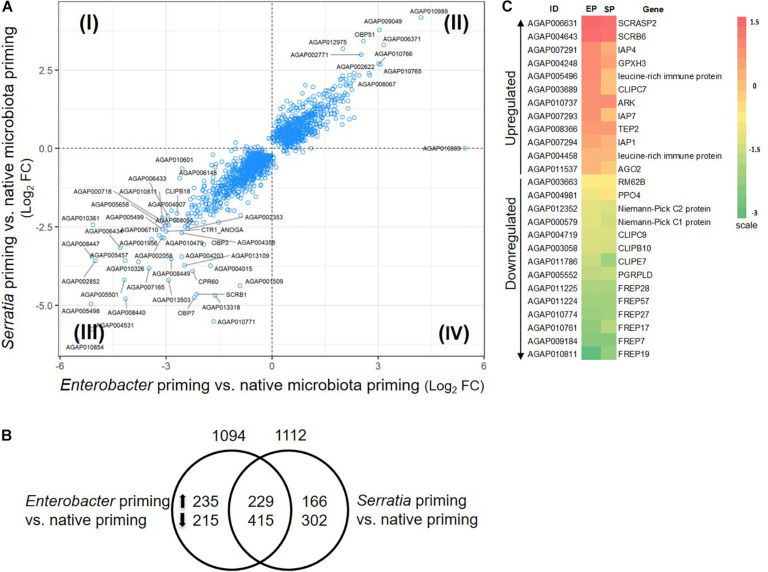
FIGURE 5.
Priming effect of single bacterial diet on the transcriptome without bacterial challenge. (A) Transcriptomes in the cohort with Enterobacter or Serratia priming showed a similar response pattern, majority of genes were regulated in the same direction, plotted in quadrant II and III. Plotted are genes with q-value less than 0.05 in either comparison to the cohort with native microbiota. Labeled genes have log2 fold change (FC) in either comparison greater than 2.5 or less than –2.5. (B) Distribution of the genes that were altered by individual priming. Total number of altered genes is placed on top of the circle, the number of up- or down-regulated genes were specified inside the circle. (C) The heatmap illustrates the immune genes that were affected by the Enterobacter (EP) and Serratia (SP) priming compared to the native priming. The color scale represents the log2 fold change between the EP or SP and native community.

