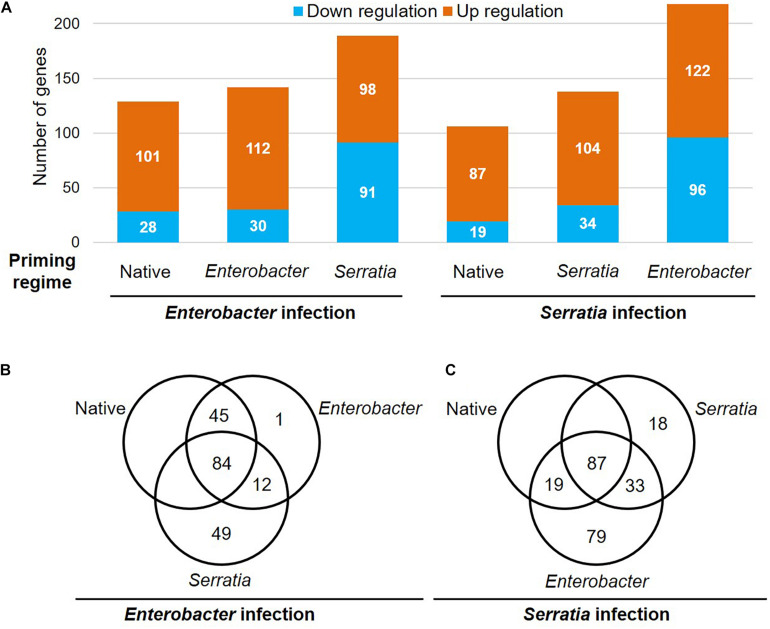
FIGURE 9.
Priming effects on the transcription of the immune genes upon Enterobacter and Serratia challenge. (A) The number of upregulated or downregulated genes is presented in each priming regime upon respective bacterial challenge. (B,C) The Venn diagram exhibits genes that were responsive to the respective infection in the cohort with respective priming regime.

