
Figure 10. Correlation plots for GDCC (combined OA and exo-OA) and exo-OA ranked submissions.
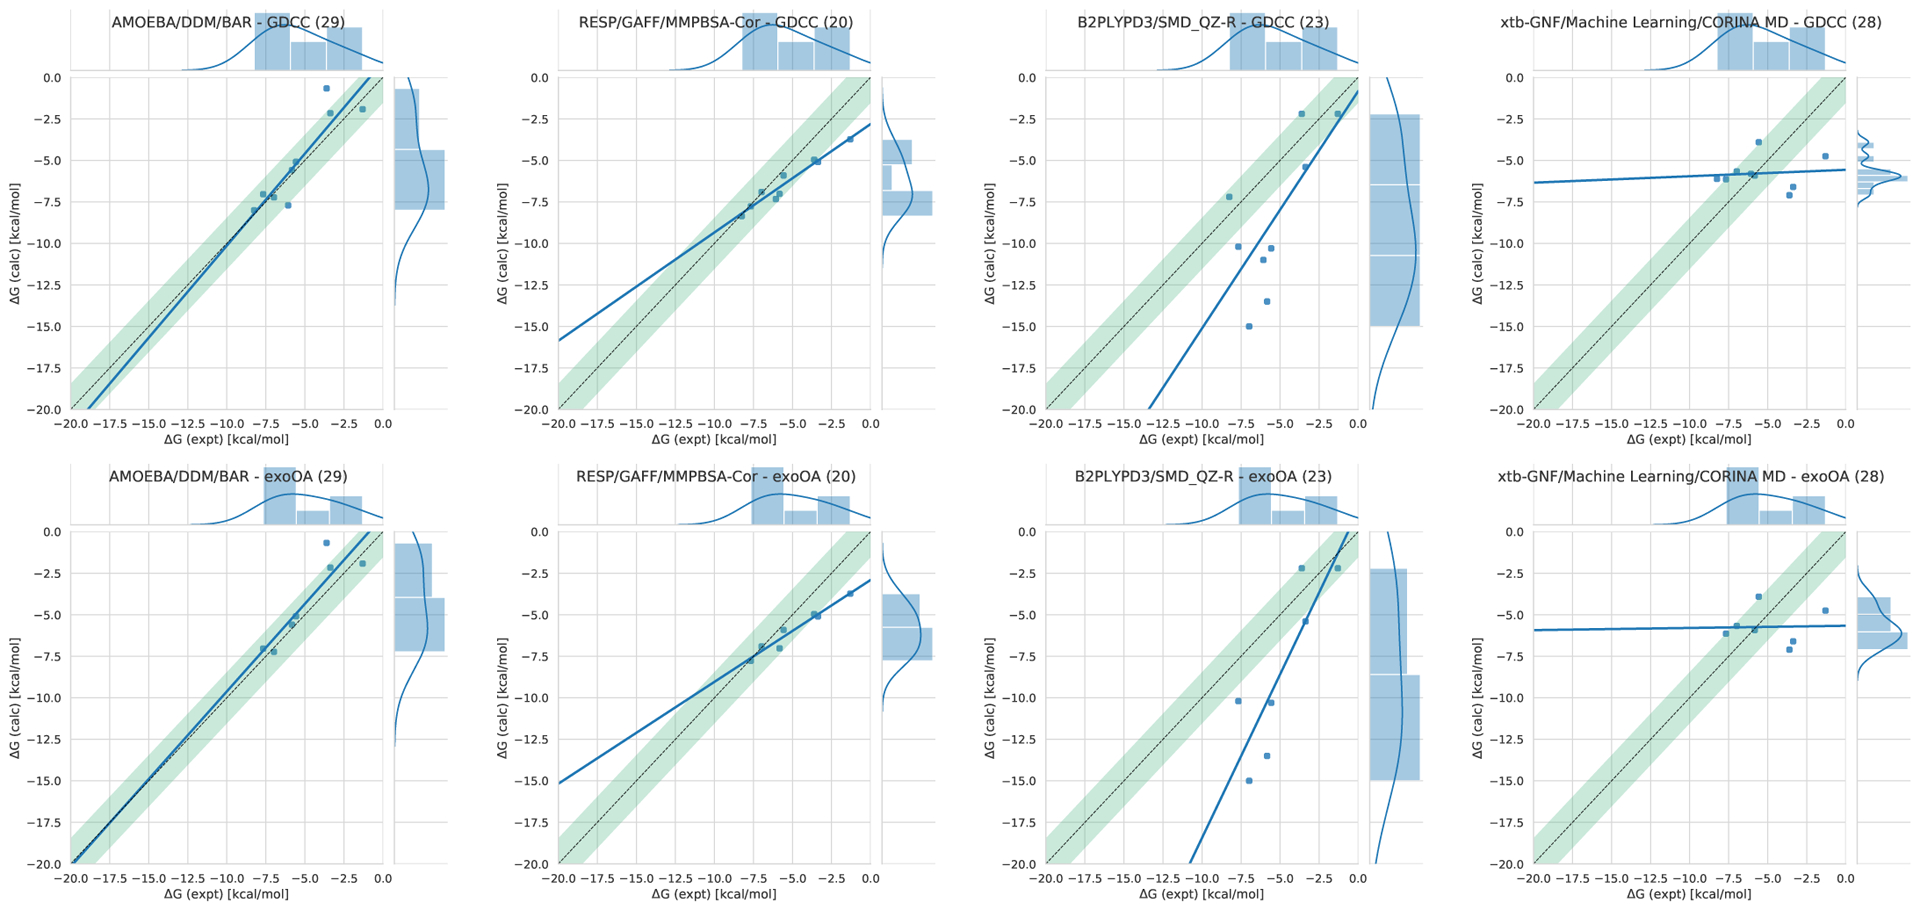
Shown are correlation plots comparing calculated and experimental values for (Left to Right) AMOEBA/DDM/BAR, RESP/GAFF/MMPBSA-Cor, B2PLYPD3/SMD_QZ-R, and xtb-GNF/Machine Learning/CORINA MD ranked predictions for GDCC (top row) and exo-OA (bottom row). The AMOEBA/DDM/BAR approach performed particularly well by a variety of metrics, as did RESP/GAFF/MMPBSA-Cor. The former had the slope closest to 1 and its RMS error was among the lowest, whereas the latter performed better on error and correlation metrics but had a slope which was systematically incorrect. (See Table 3)