
Figure 11. exo-OA Error Metrics for Ranked Methods.
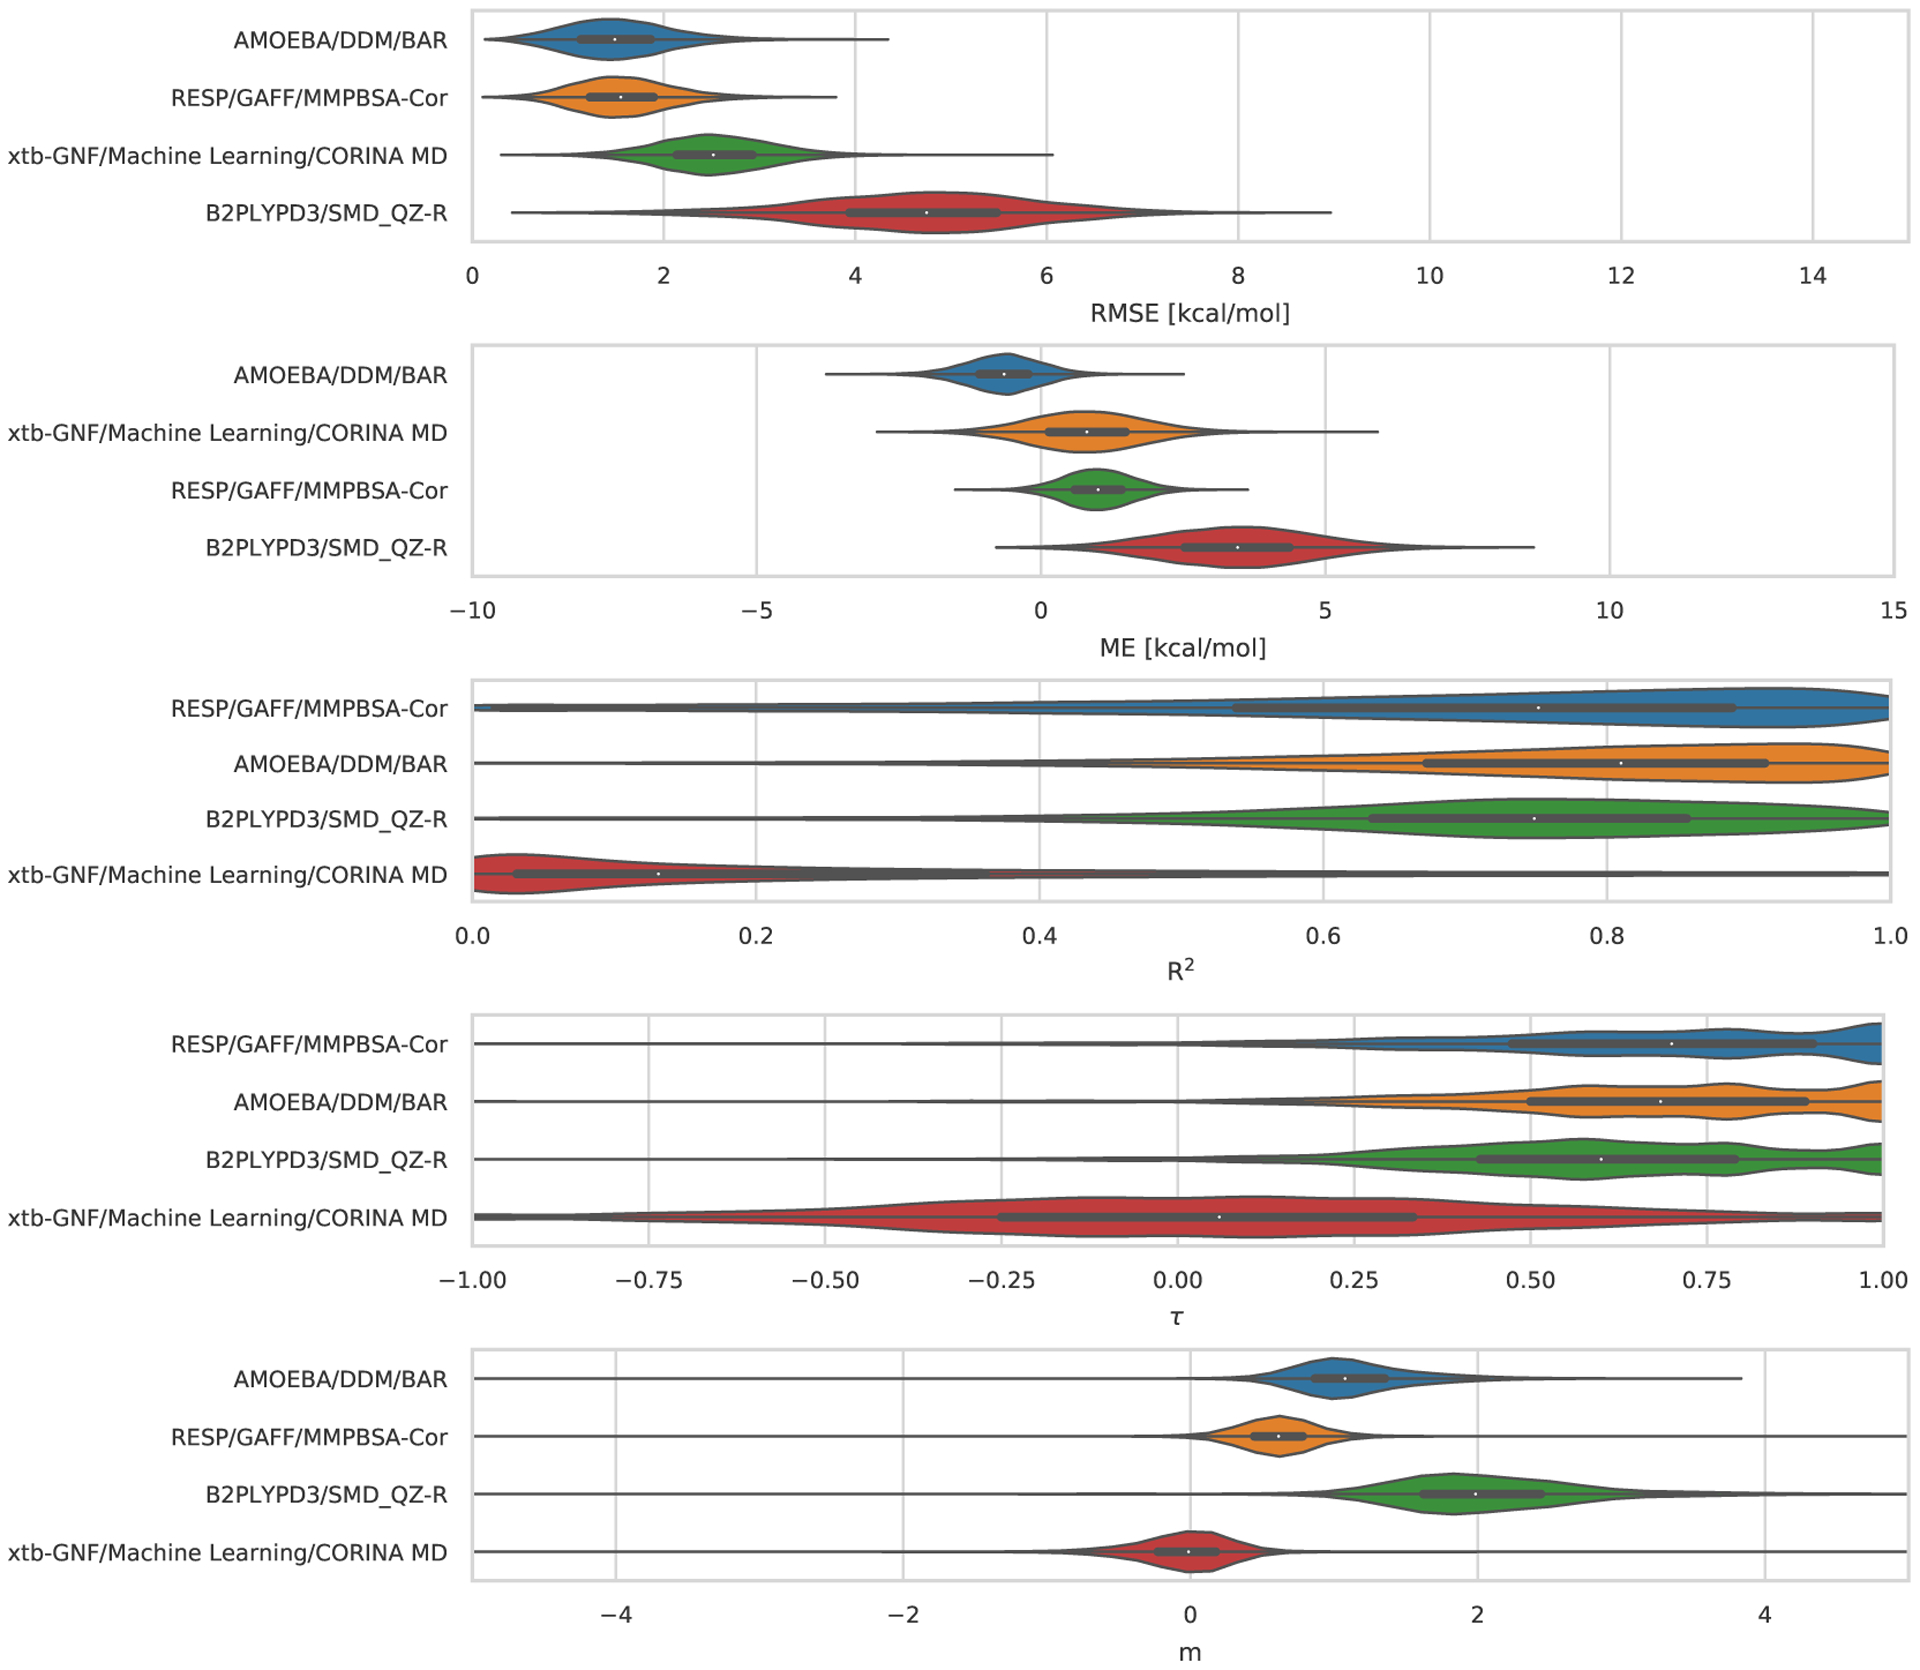
Shown are exo-OA methods, with the median indicated by the white circle in the violin plots. The violin plots for RMSE, ME, R2, τ, and slope describe the shape of the sampling distribution after bootstrapping for each method. The black horizontal bar represents the first and third quartiles. From top to bottom the error metrics are RMSE, ME, R2, τ, and slope (m).