
Figure 12. Cyclodextrin derivatives error metrics for ranked methods.
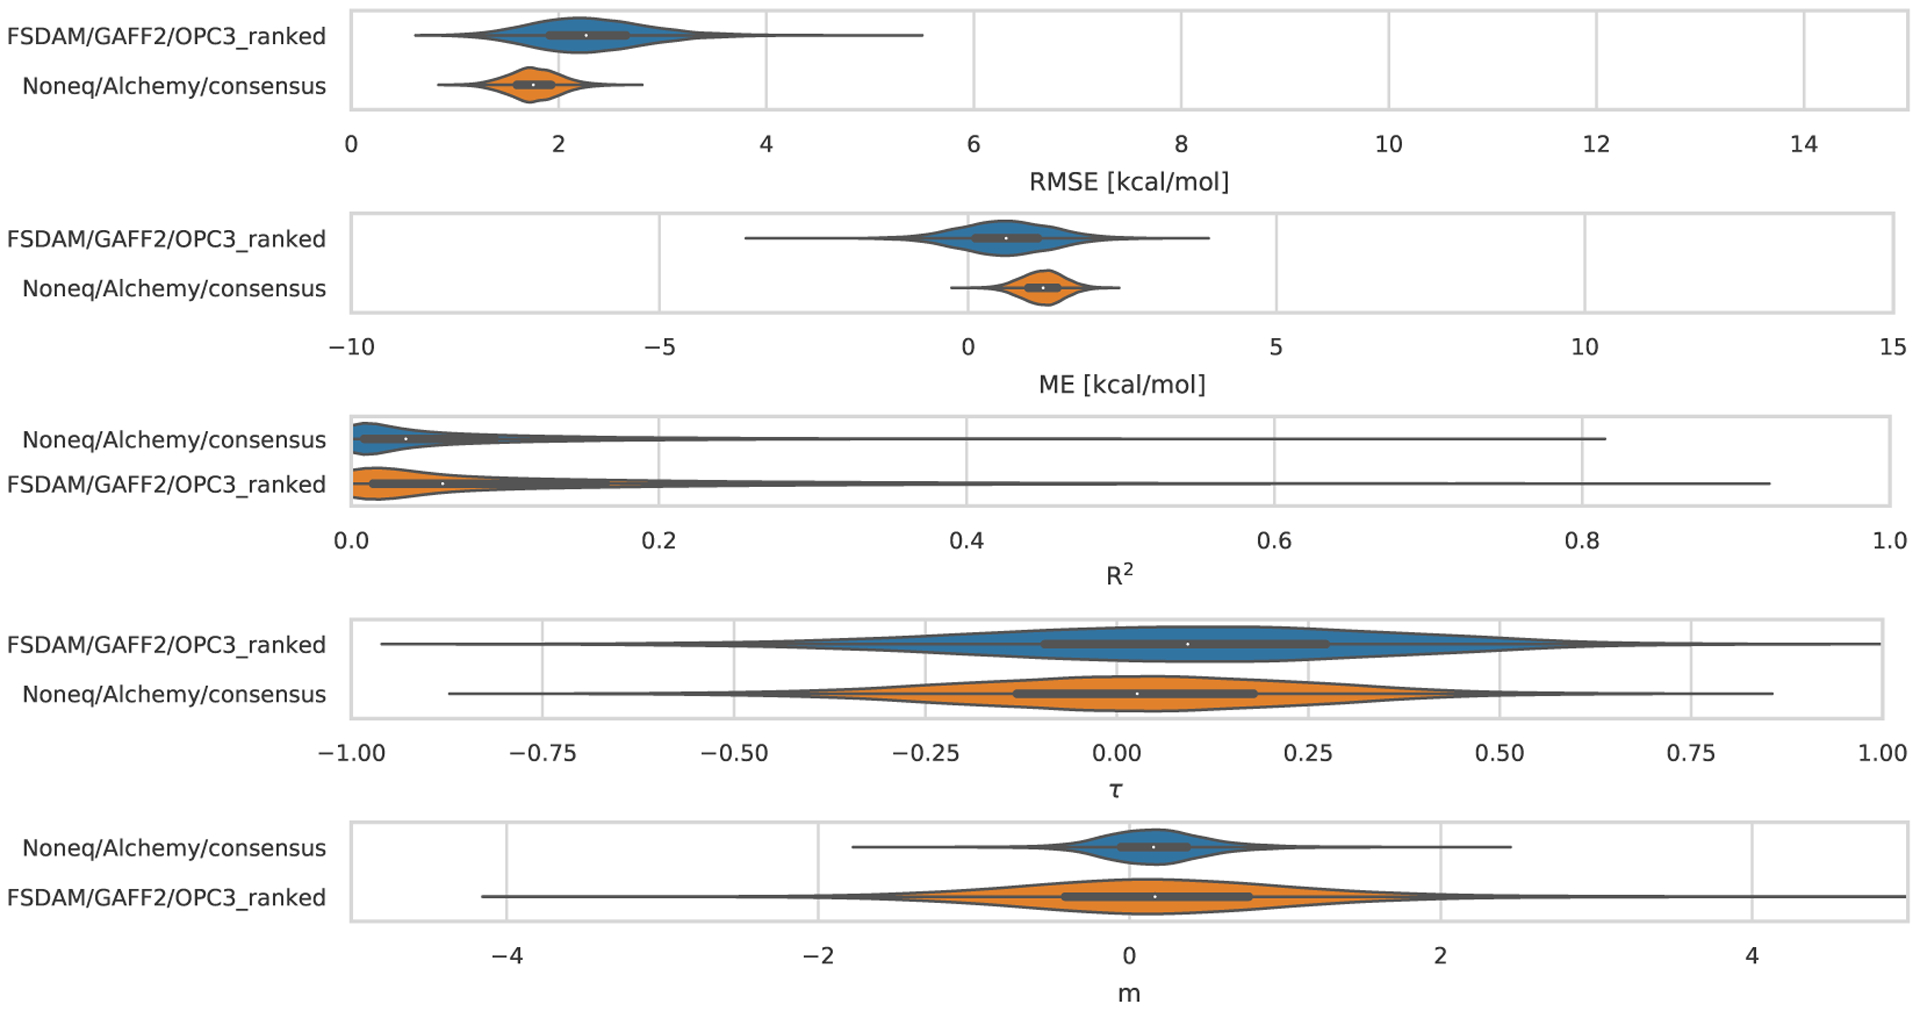
Shown are CD submissions ordered based on the median and is indicated by the white circle in the violin plots. The violin plots were generated by bootstrapping samples with replacement, and the plots describe the shape of the sampling distribution for each prediction. The black horizontal bar represents the first and third quartiles. From top to bottom the error metrics are RMSE, ME, R2, τ, and slope (m). AM1-BCC/GAFF/TIP4PEW/QMMM method was not included in these plots. In addition, the optional bCD-g1 and bCD-g2 host-guest systems are not included in this analysis.