
Figure 1: Dihedrals are uniformly sampled during MolDarting.
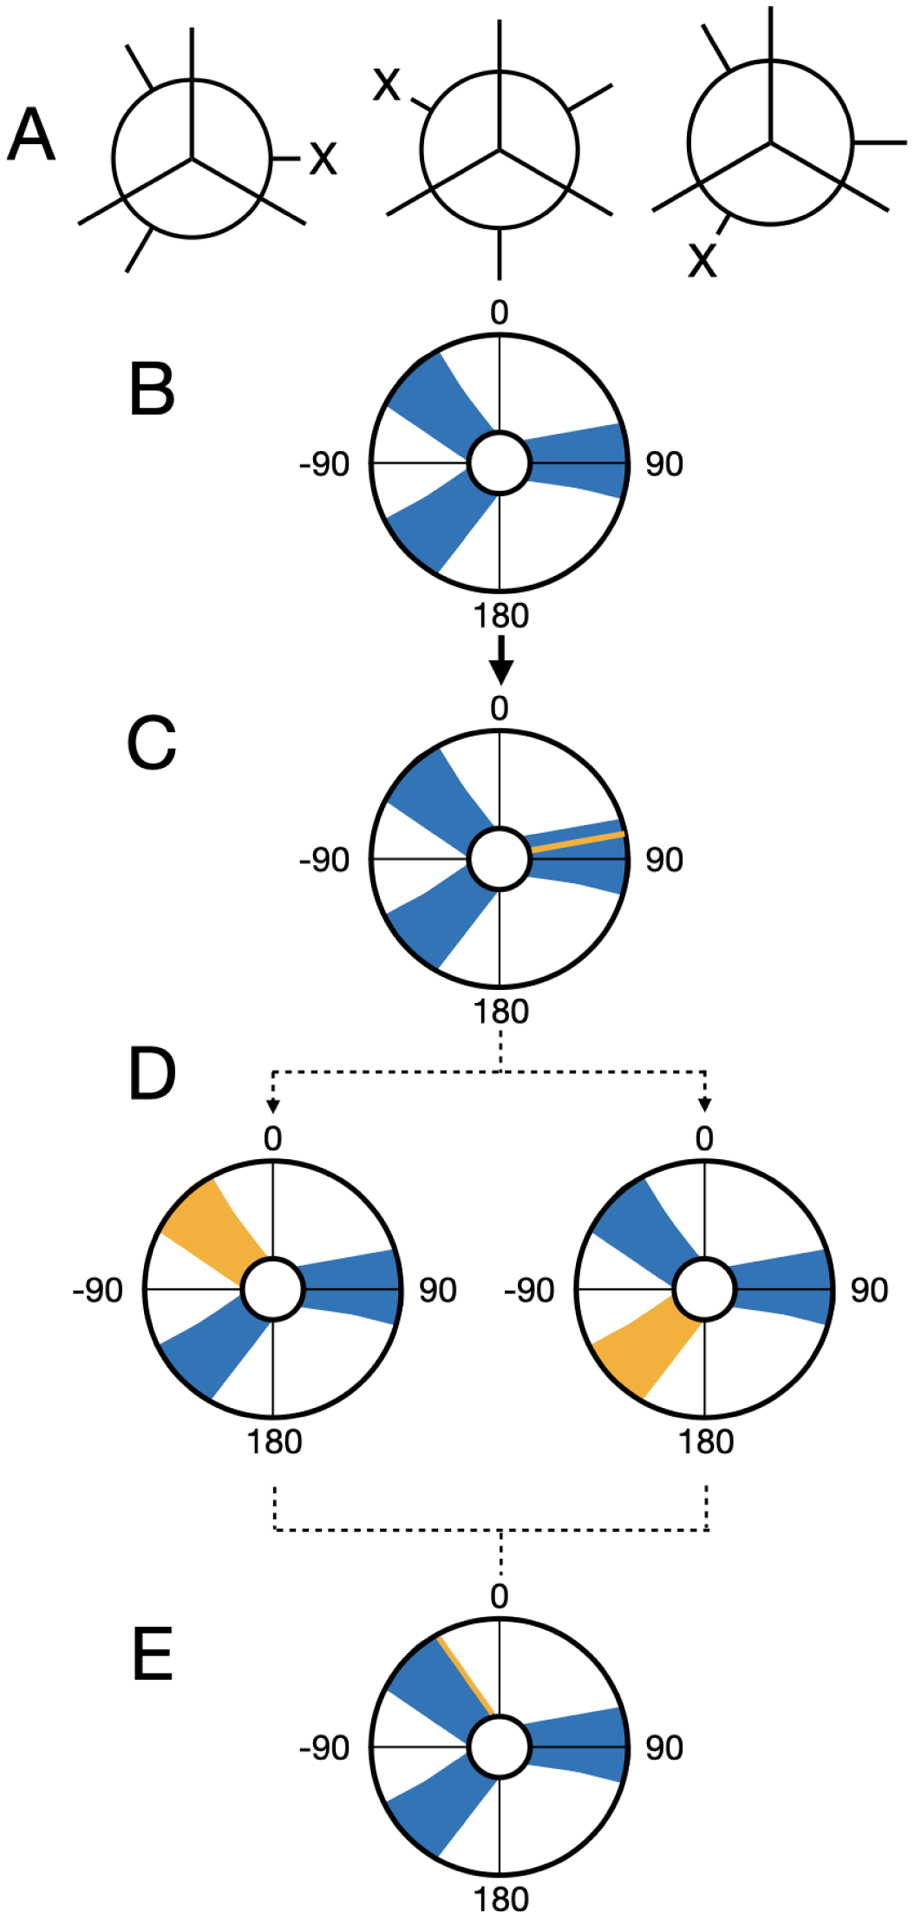
We illustrate how we perform our dihedral darting moves using a rose plot representation of a dihedral angle (in degrees) as an example. The dihedral regions are represented by the blue areas, and the current dihedral angle is represented by the yellow line/areas. In this example, there are three total darts, each with an associated region. (A) The Newman projection of a hypothetical ligand illustrating three different stable conformations. (B) A representation of the three dihedral regions for the three conformations. (C) When a particle is within a dihedral region then a darting move can be performed. (D) When MolDarting the dihedrals, the new dihedral is selected uniformly from a region the dihedral is not currently in (shown in yellow). The arrows refer to the two potential outcomes of the MolDarting move in which the ligand is darted to a new configuration. (E) One of the other dihedral regions are chosen randomly (with equal probability) to be MolDarted, and then a new dihedral is chosen randomly from the chosen region, resulting in a new configuration.