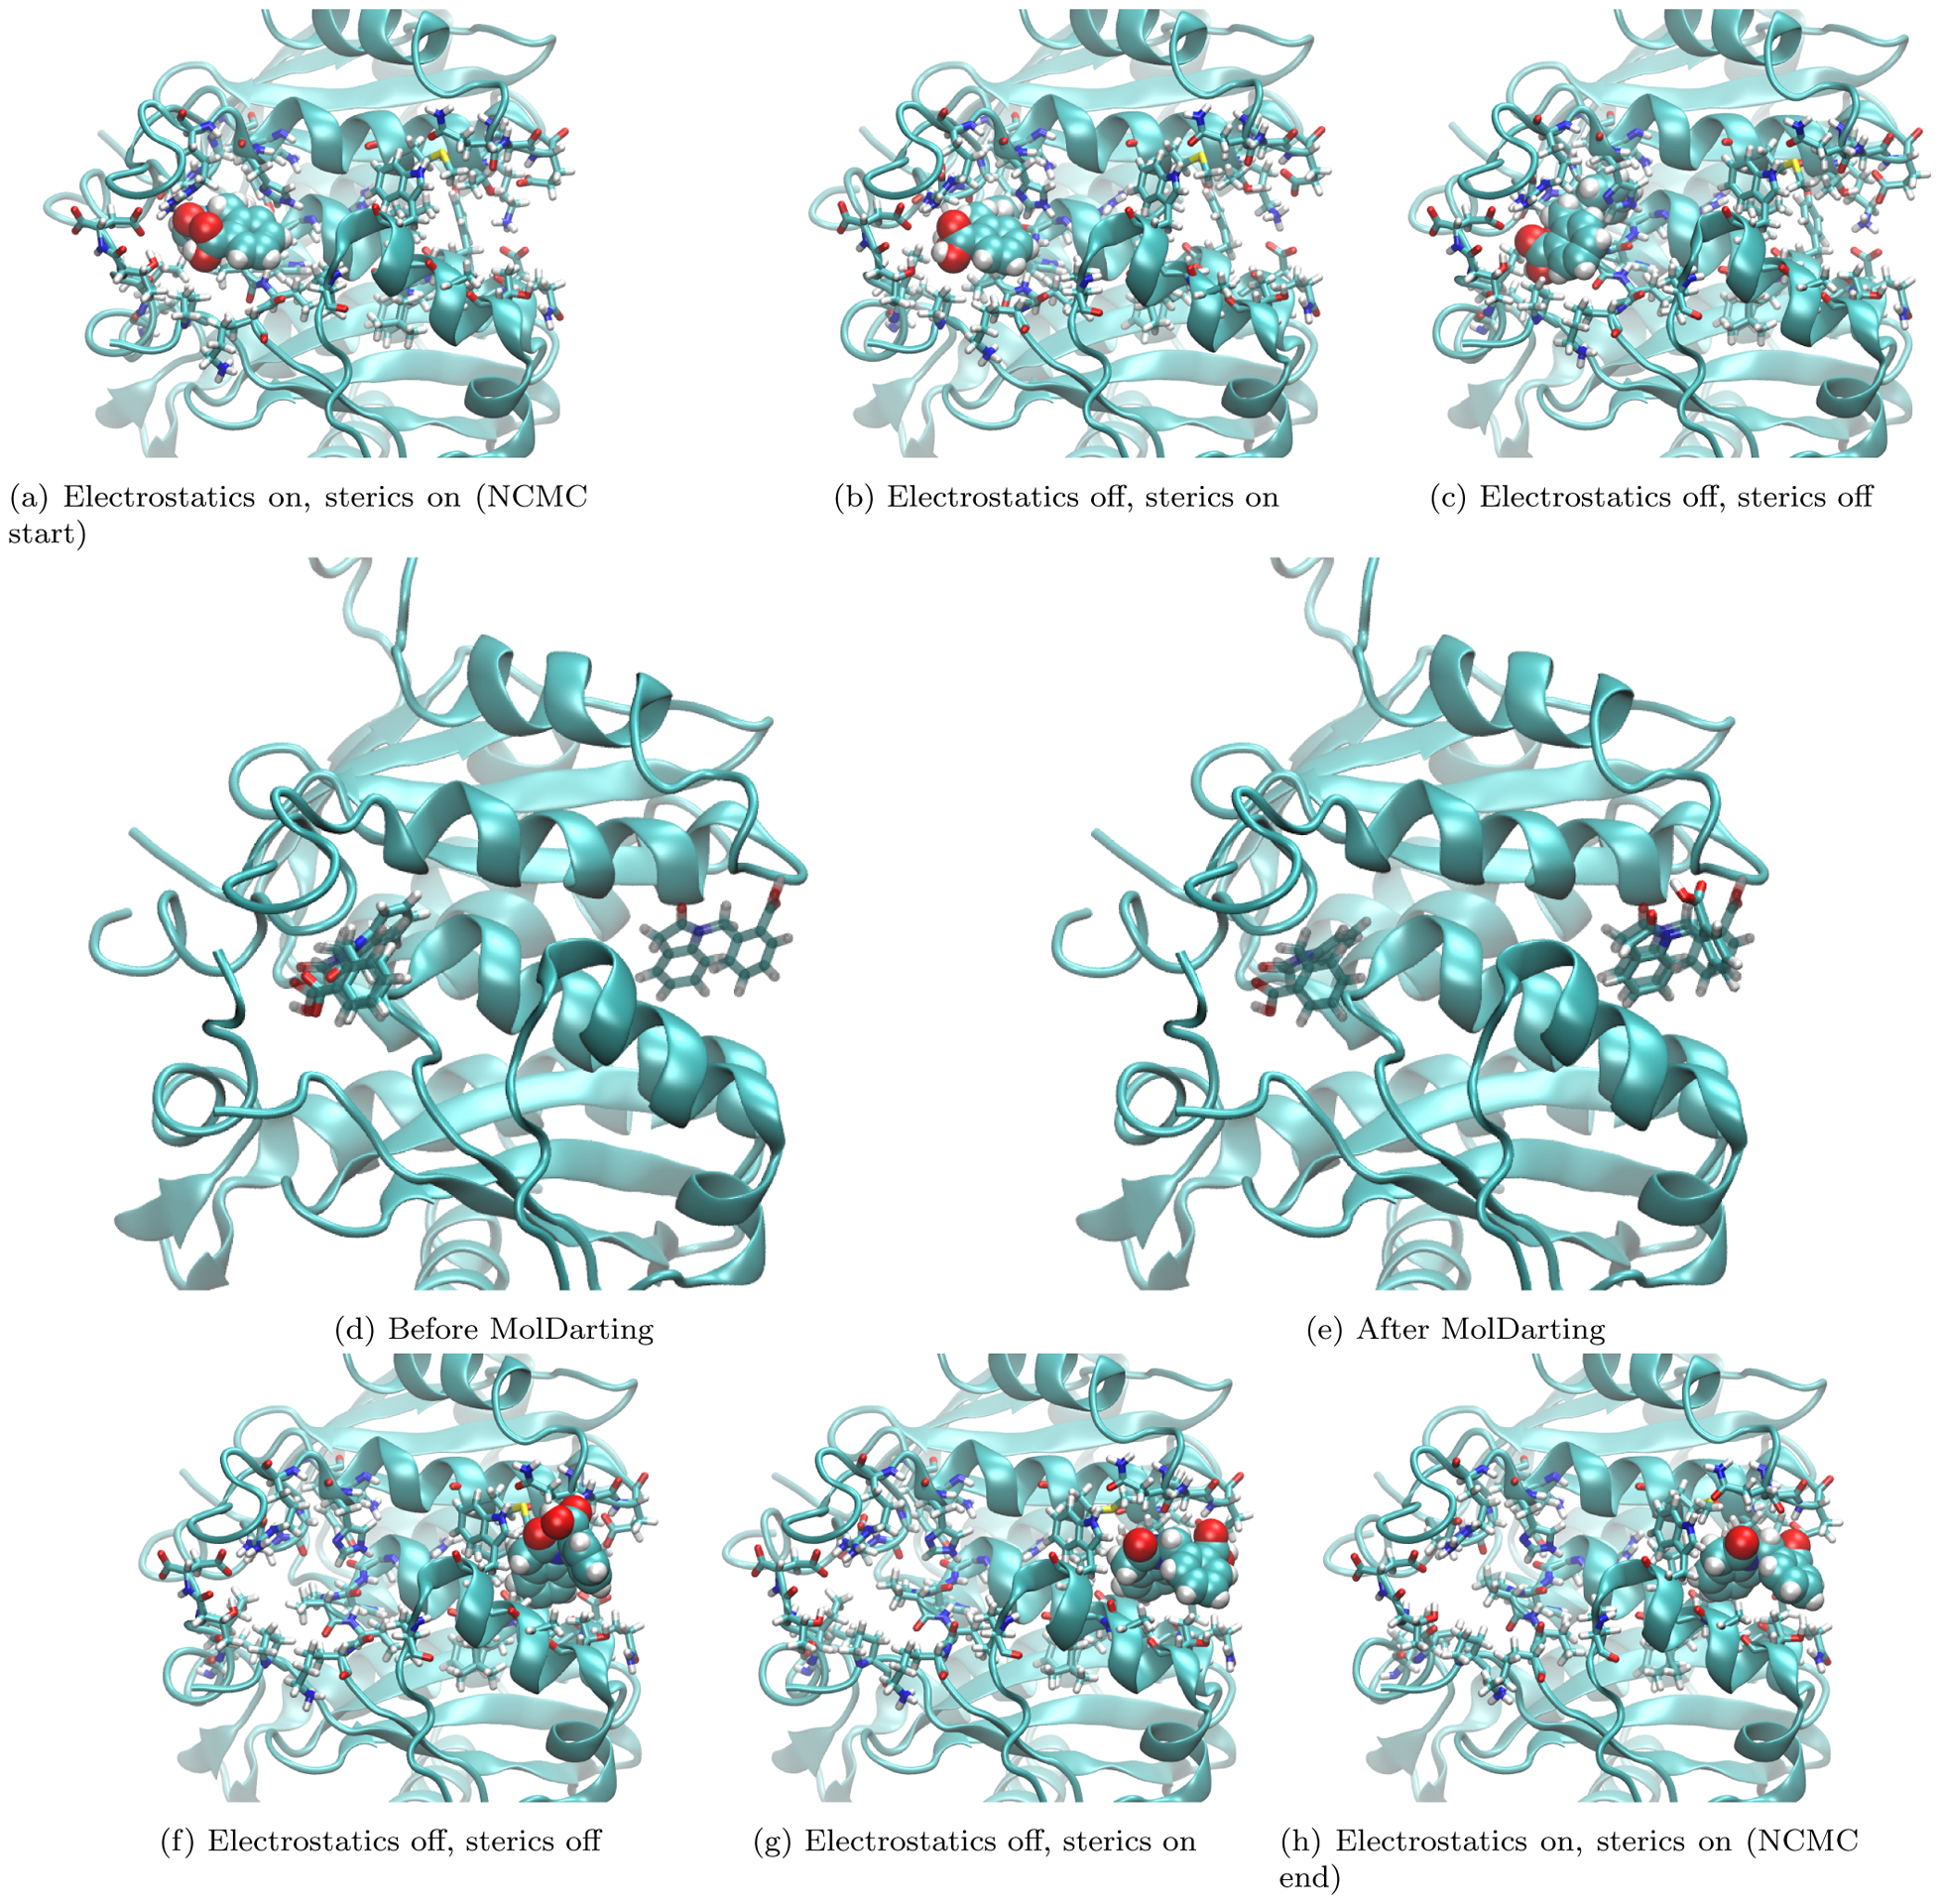
Figure 13: MolDarting depends on the defined regions to jump to a new binding mode.

Here we show an example of a MolDarting Move attempt with NCMC. The ligand here is represented in VDW representation in (a-c,f-h), with the binding site sidechains shown in licorice representation, and the rest of the protein shown in cartoon representation. Panels (a-c) and (f-h) focus on turning the ligand off and back on, while panels (d) and (e) focus on a jump to a new binding mode. (a) shows the system at the start of the NCMC move, with the ligand fully interacting. (b) shows the system when the electrostatic interactions of the ligand are turned off, but the sterics are still fully interacting, while (c) shows the system after all the ligand steric and electrostatic interactions are turned off. (d) shows the same system in (c), but with only the ligand represented in licorice to illustrate the ligand positions before darting. Also the reference poses used to define the darting regions are shown in transparent licorice representation. We can see in this example that the ligand position is quite near the reference pose. (e) shows the same system in (d) but after the MolDarting move takes place. (f) shows the same system in (e) but using the previous representation found in (a-c). The VDW representation of the ligand in (f) helps visualize some new clashes present after MolDarting that will need to be resolved before the ligand is fully interacting. g shows the system after the ligand has full steric interactions. Here we can see there is a sizable reorientation of the ligand in the binding site. In (h) the ligand’s electrostatic and steric interactions are restored, and the protocol work accumulated is then used to accept or reject these new positions as shown here.
