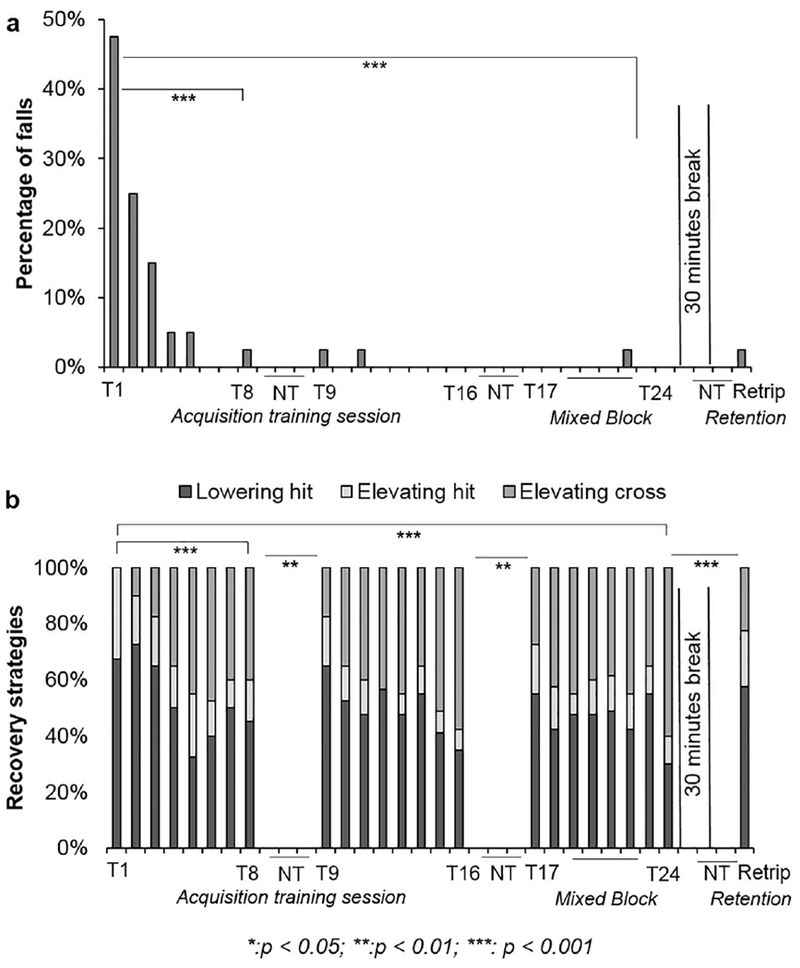
Figure 4.

Trip recovery outcomes and strategies. Shown are a) the percentage of falls for each trip and b) the percentage of each strategy used for trip recovery from each trip trial. T represents the trip trials, NT represents the unperturbed walking trials, and Retrip represents the trip trial after the 30-minute break.
