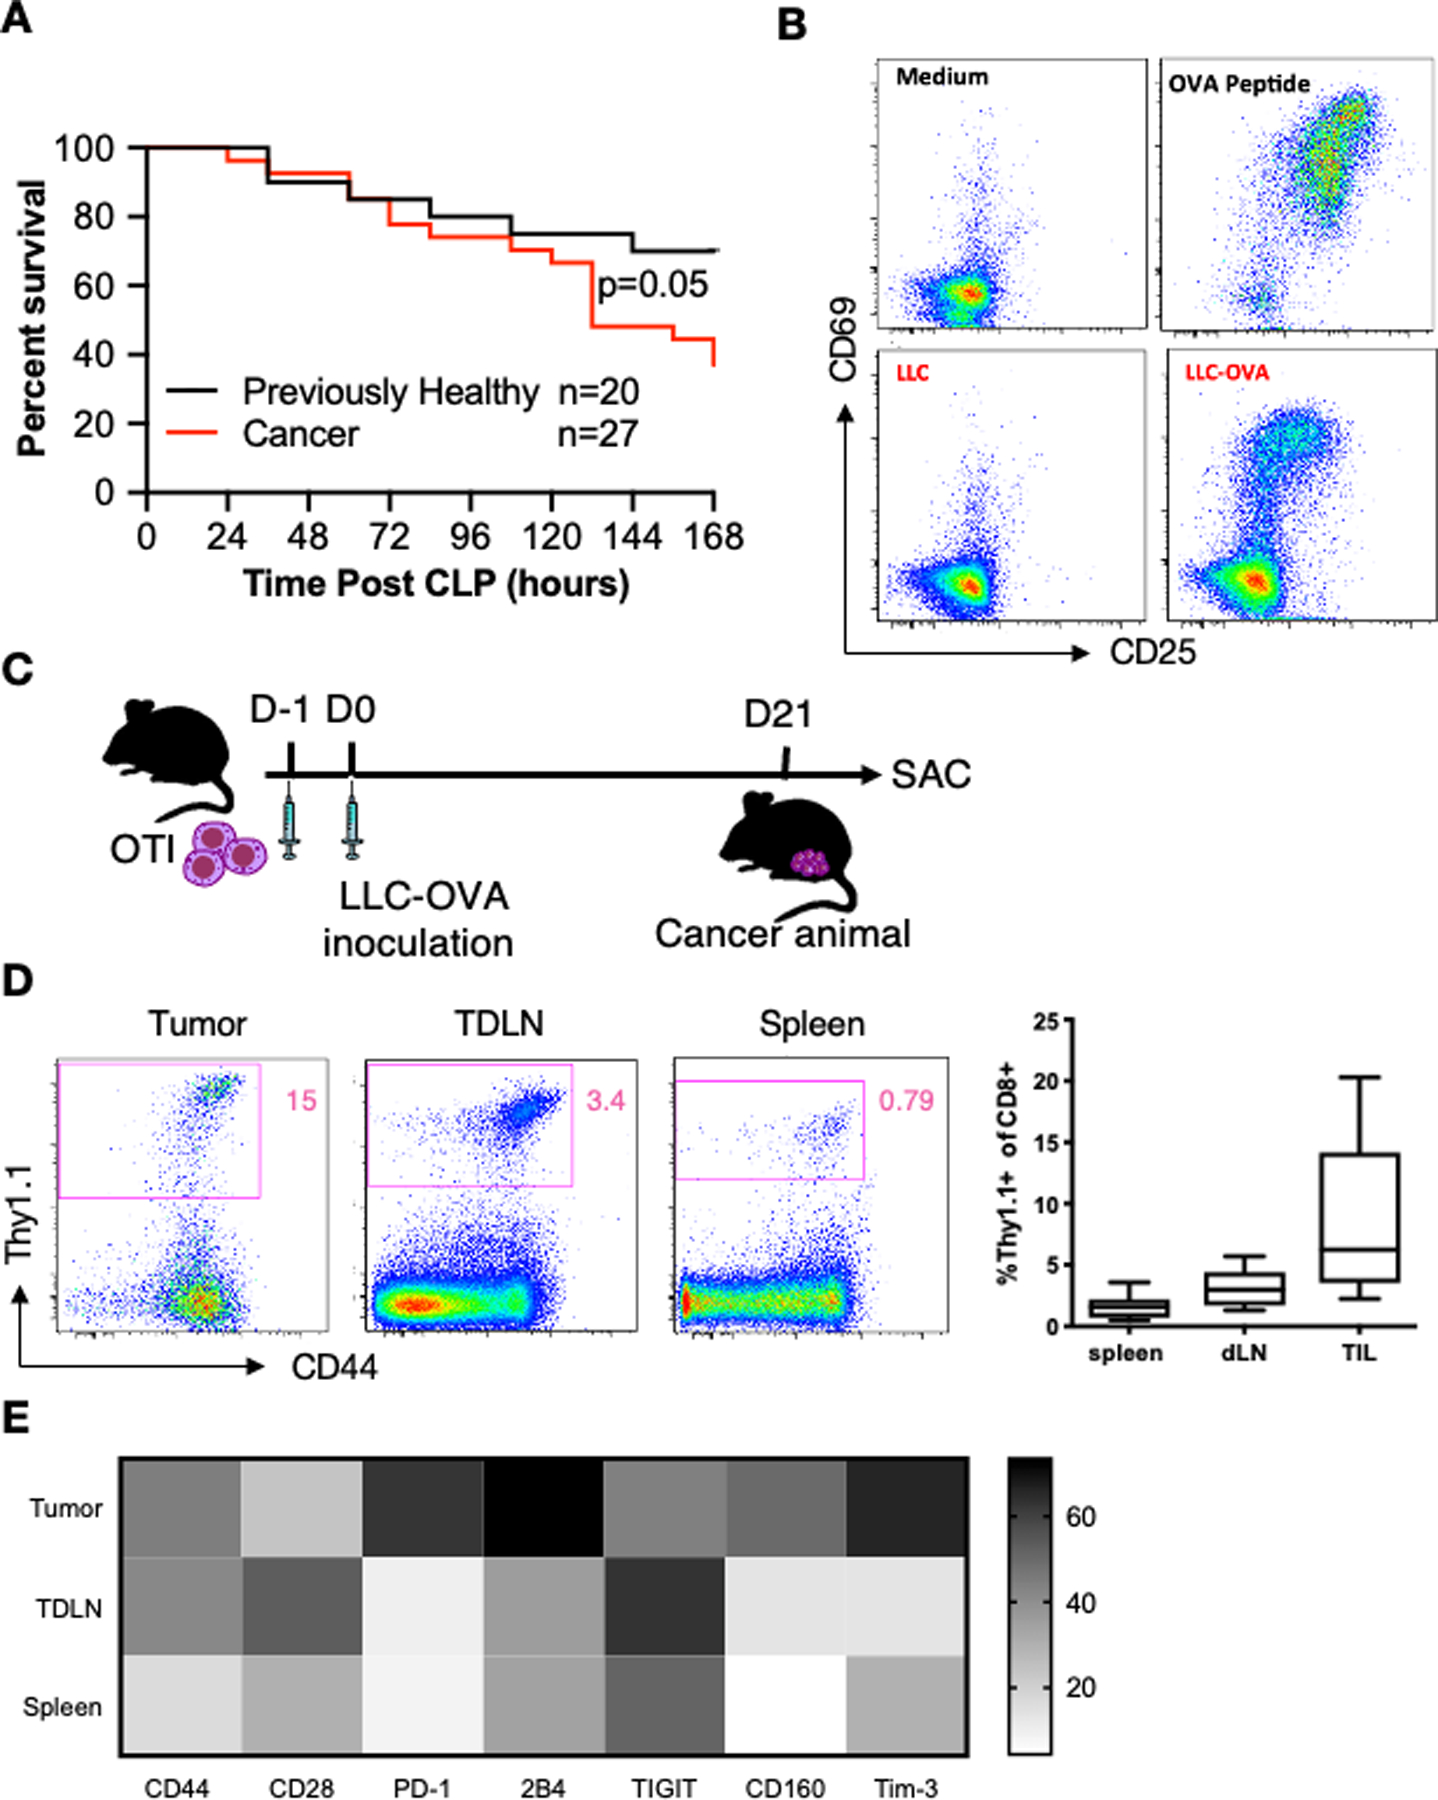
Figure 1. LLC-OVA activates OT-I cells in vitro and in vivo.

(A) Graph summarizing the survival difference between cancer and previously healthy mice following CLP. Cancer was induced in mice through inoculation with LLC cells in the right flank. Mice who did not receive LLC cells served as previously healthy controls. Three weeks later, all mice underwent CLP. Mice were then monitored for survival for 7 days. (B) OT-I splenocytes were co-cultured with medium, OVA peptide, LLC or LLC-OVA for four days. Representative flow cytometry plots show staining for the activation markers CD25 and CD69 after incubation for each condition. All cells were gated on CD3+CD8+Thy1.1+ cells (see Supplemental Figure 1 for gating strategy for tumor-specific cells). (C) Schematic showing the timeline for LLC-OVA cancer experiments. OT-I cells were adoptively transferred into animals. One day later, LLC-OVA was inoculated into the right thigh. Three weeks later, mice were euthanized, and OT-I cells were harvested from various tissues. (D) Representative flow cytometry plots (gated on live CD45+CD3+CD8+ cells) showing the percentage of OT-I cells of total CD8+ T cells in the tumor, TDLN, and spleen (left) and summary graph (right). (E) Heatmap showing the activation and exhaustion phenotype of OT-I cells from the tumor, TDLN, and spleen. The MFI of each surface marker was used to generate the heatmap.
