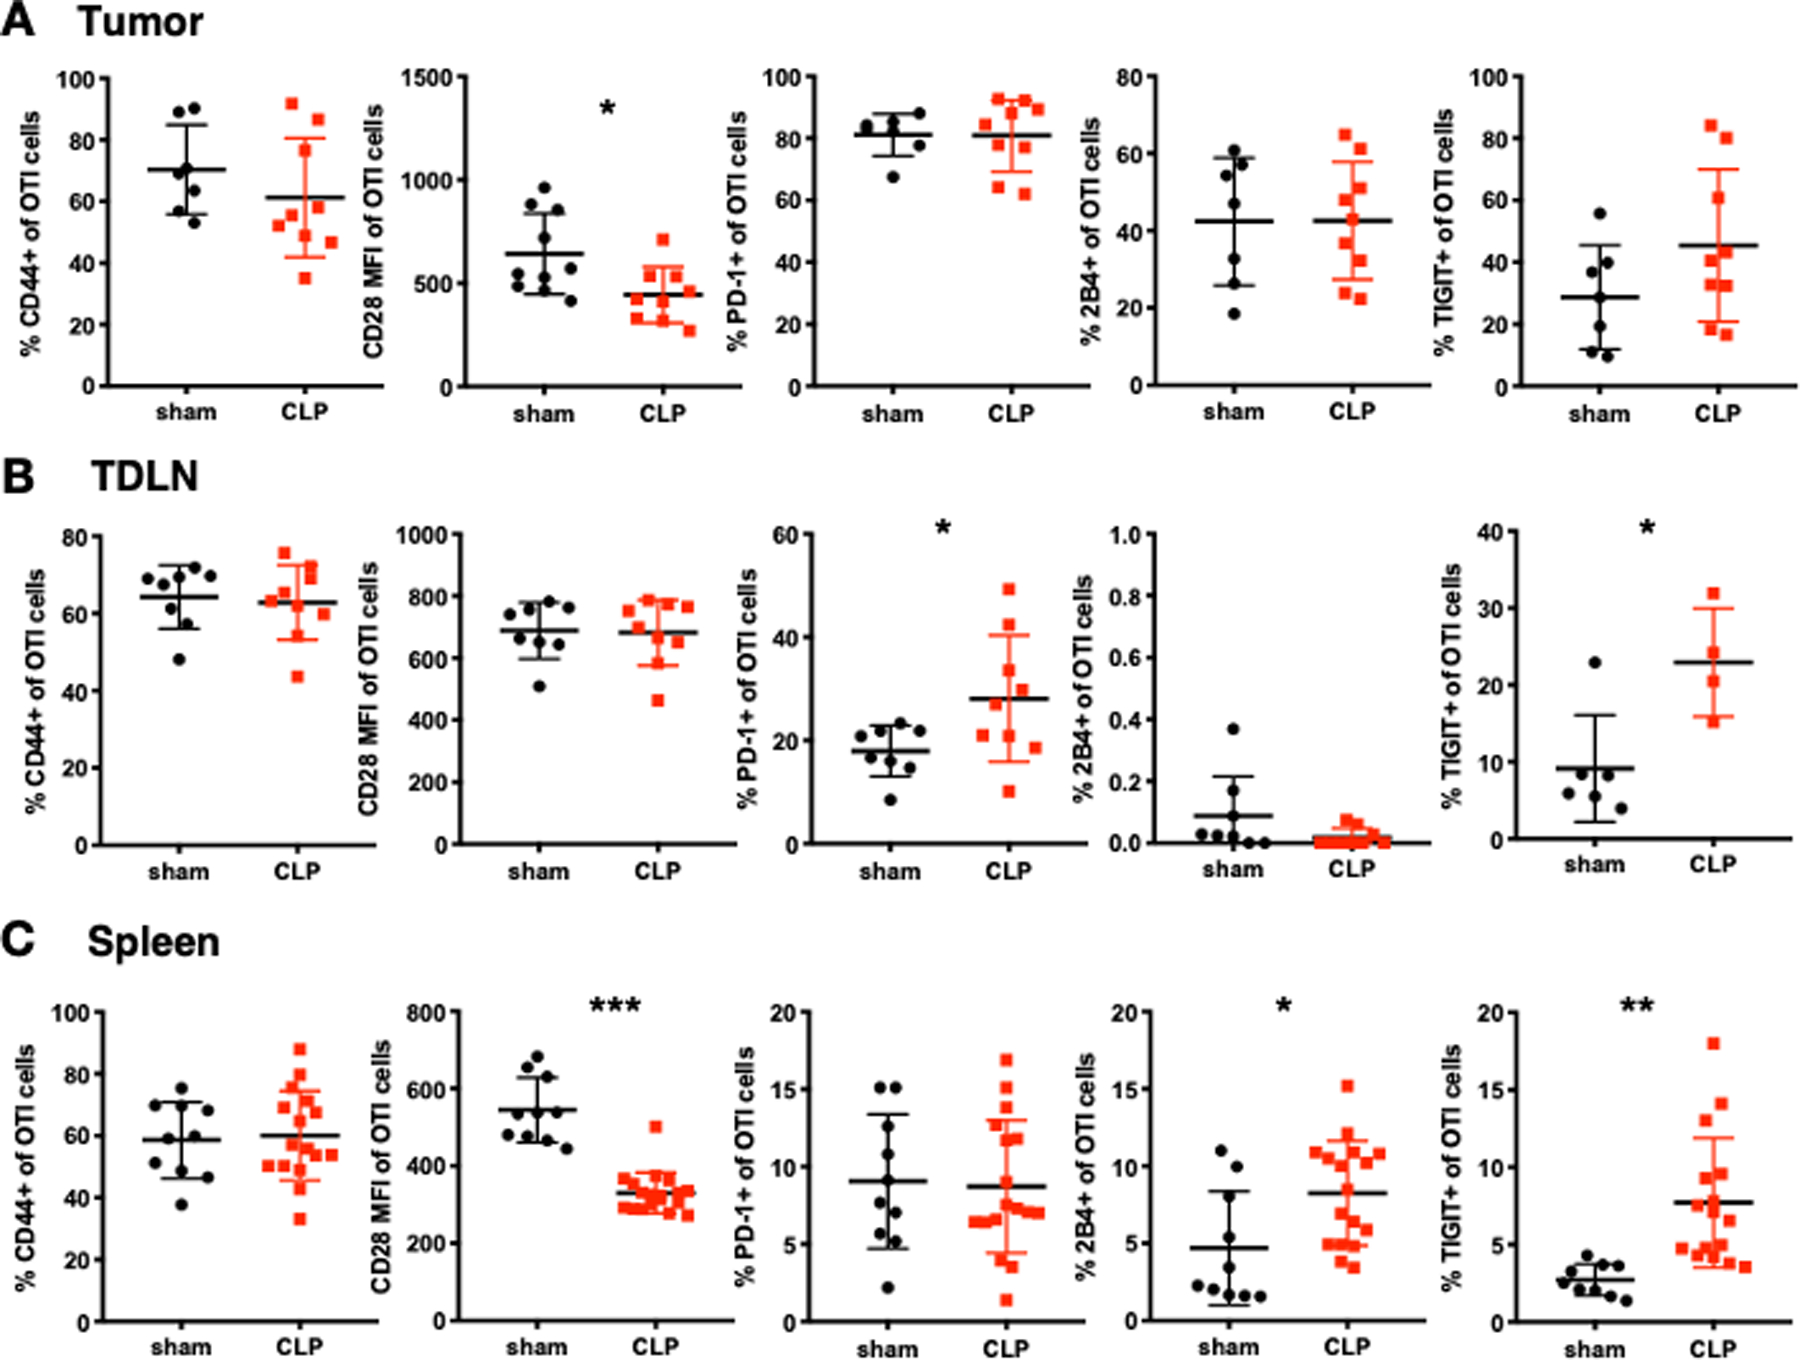
Figure 5. T cells in the spleen and tumor draining lymph node have increased co-inhibitory receptor expression in cancer sepsis.

LLC-OVA cancer animals were sacrificed at 24 hours post CLP. The phenotype of OT-I cells (gated on CD3+CD8+Thy1.1+ cells) in sham and CLP mice were determined. (A) Summary graphs showing the frequency and MFI of activation (CD44, CD28) and exhaustion (PD-1, 2B4, TIGIT) markers on OT-I cells in the tumor. (B) Summary graphs showing the frequency and MFI of activation (CD44, CD28) and exhaustion (PD-1, 2B4, TIGIT) markers on OT-I cells in the tumor draining lymph node (TDLN) at 24 hours post CLP. (C) Summary graphs showing the frequency and MFI of activation (CD44, CD28) and exhaustion (PD-1, 2B4, TIGIT) markers on OT-I cells in the spleen at 24 hours post CLP. *p≤0.05, **p≤0.01, ***p≤0.001.
