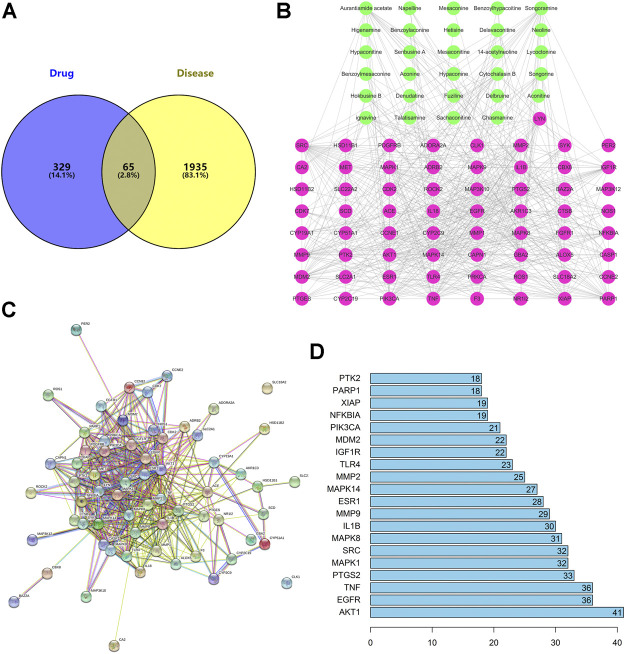
FIGURE 3.
(A) There are 65 overlapping targets between disease and drug. (B) C–T network. The 29 green nodes indicate the active ingredients of GA for drug treatment. The 65 pink nodes indicate coincident targets between disease and drug. The edges denote that nodes can interact with each other. (C) PPI network. (D) Bar plot of the PPI network. The x-axis represents the number of neighboring proteins of the target protein. The y-axis represents the target protein.

