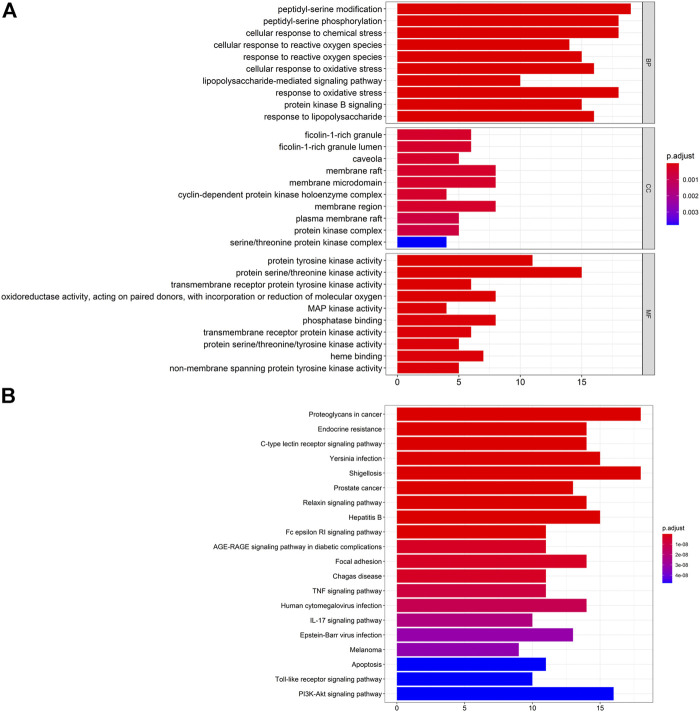
FIGURE 4.
(A) Analyses of 65 targets associated with gouty arthritis using the GO database. The x-axis represents significant enrichment of these term counts. The y-axis represents the category of "biological process”, “cellular component” and “molecular function” in the GO of target genes (p < 0.05). (B) Pathway-enrichment analyses using the KEGG database. The x-axis represents the count of targets in each pathway; the y-axis represents the primary pathway (p < 0.01).

