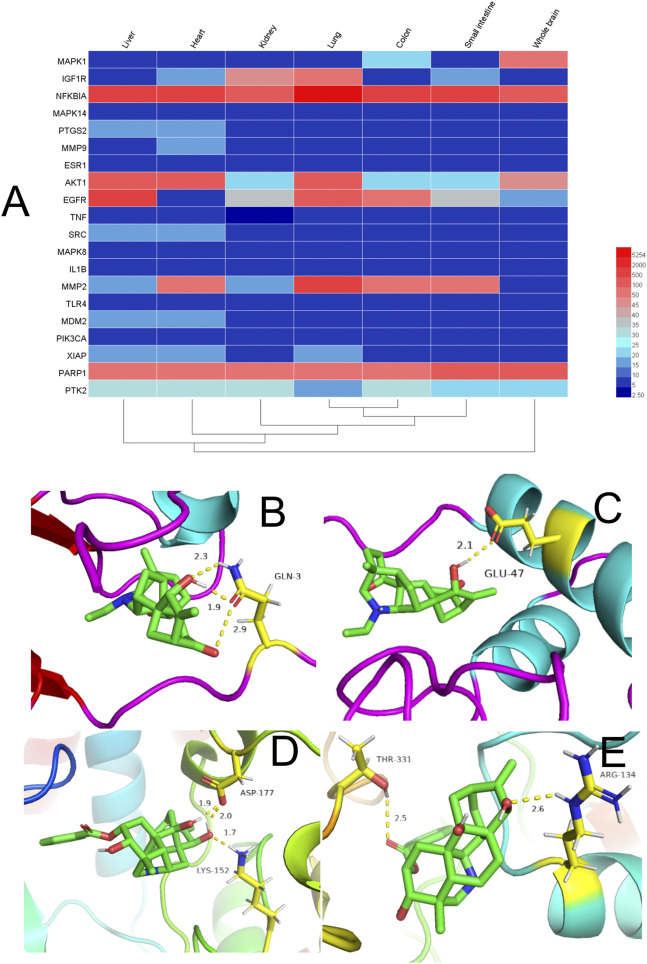
FIGURE 5.
(A) Heatmap of organ expression of 20 targets. The x-axis indicates the organ name. The y-axis indicates the target name; from left to right, liver, heart, kidney, lung, small intestine, and whole brain. (B-E) Binding studies of selected compound–target interactions. (B) Songoramine with MAPK14. (C) Songoramine with MMP9. (D) Ignavine with MAPK14. (E) Ignavine with MMP9. Molecules are represented by a ball-and-stick model. Hydrogen bonds are represented by a dotted line, and numbers indicate hydrogen-bond distances in angstroms. Atoms C, O and N are green, red and blue, respectively.

