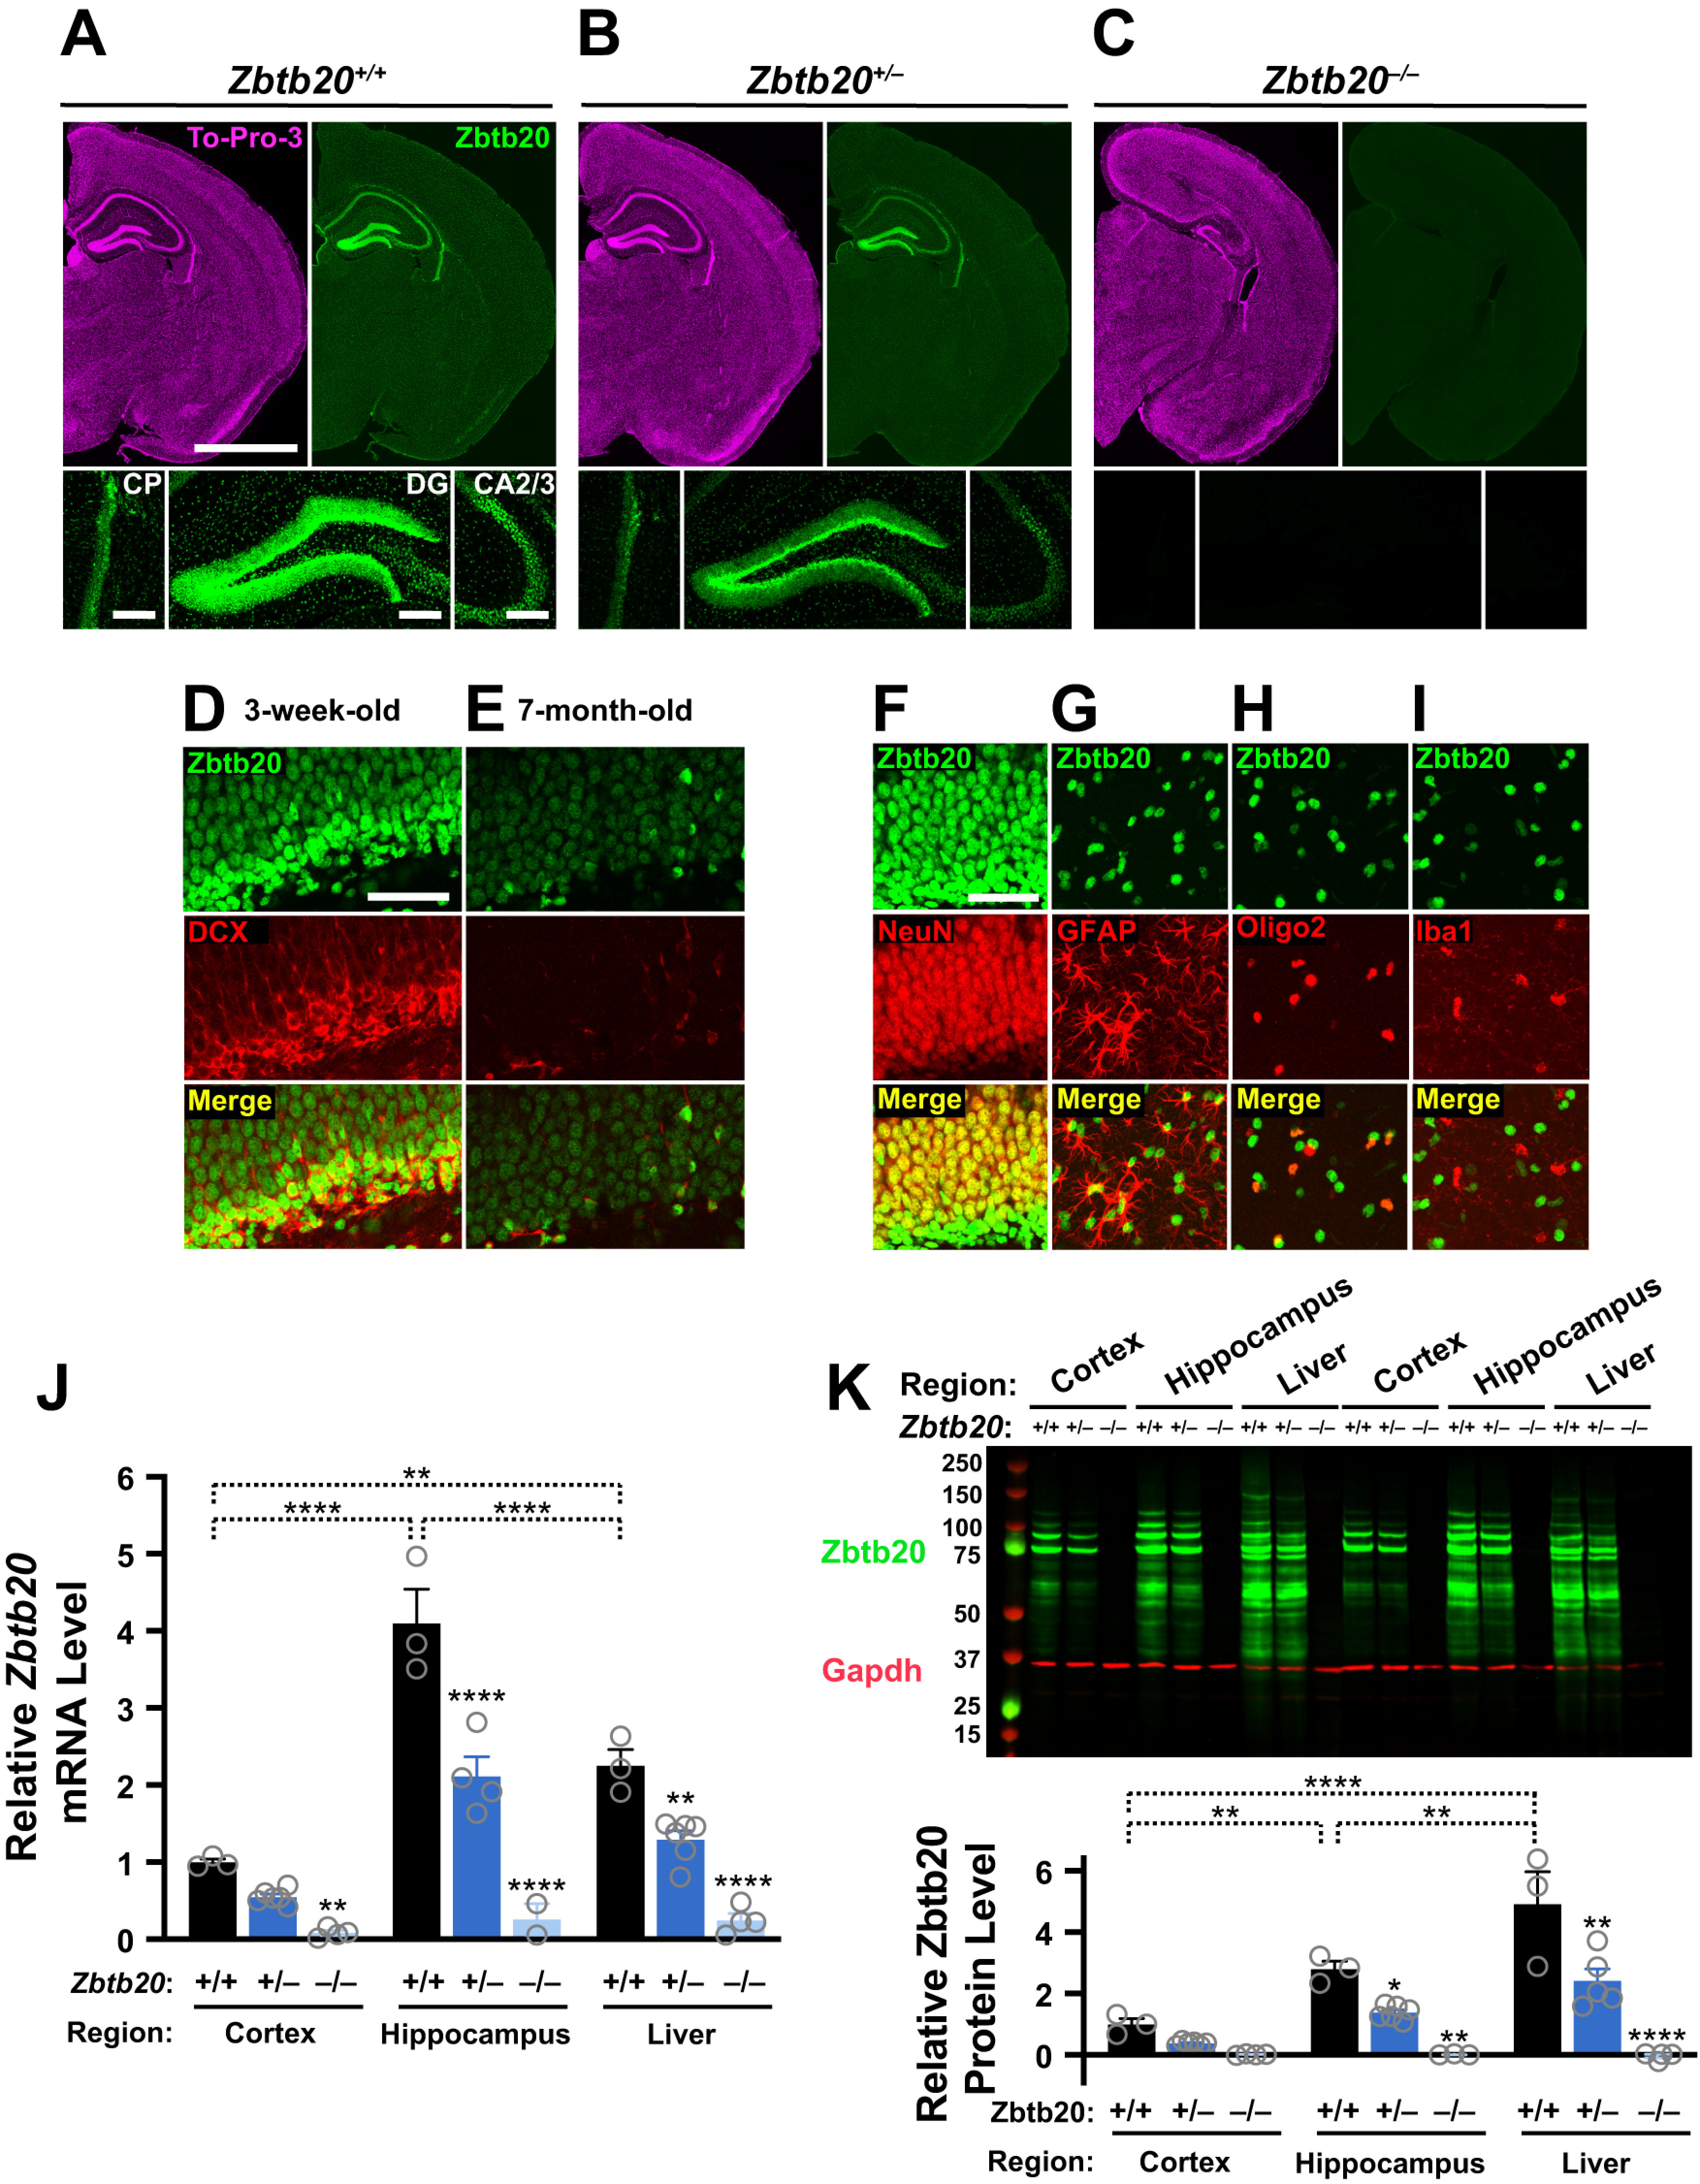
Figure 2.

Zbtb20 mRNA and protein expression in Zbtb20+/+, Zbtb20+/–, and Zbtb20–/– mice. A–C, Coronal brain sections from three-week-old mice of the indicated genotypes were stained with TO-PRO-3 to identify nuclei (top-left in each panel), labeled with an antibody (BD Biosciences, catalog #565453) against Zbtb20 (top-right and bottom row in each panel), and imaged by epifluorescence microscopy. Hemibrain sections (scale bar: 2 mm) are shown at the top and magnified views (scale bar: 200 μm) of the choroid plexus (CP; left), dentate gyrus (DG; center), and CA2/3 (right) at the bottom. D,E, Coronal brain sections from three-week-old (D) and seven-month-old (E) WT mice were co-immunostained for Zbtb20 and doublecortin (DCX) and imaged by confocal microscopy. The subgranular zone of the dentate gyrus is shown (scale bar: 50 μm). F–I, Coronal brain sections from three-week-old WT mice were immunostained for Zbtb20 and co-labeled with antibodies against cell type-specific markers for (F) neurons (NeuN), (G) astrocytes (GFAP), (H) oligodendrocytes (Oligo2), or (I) microglia/macrophages (Iba1), and imaged by confocal microscopy. The granular layer (F) and molecular layer (G–I) of the dentate gyrus are shown (scale bar: 50 μm). J,K, Zbtb20 mRNA (J) and Zbtb20 protein (K) levels in cortices, hippocampi and livers from three-week-old mice of the indicated genotypes were determined by RT-qPCR and Western blotting, respectively. J, Relative Zbtb20 mRNA levels were quantified by the 2–ΔΔCT method (Livak and Schmittgen, 2001) using Gapdh mRNA as the internal reference. Mean Zbtb20/Gapdh mRNA ratios in WT cortical samples were defined as 1.0; n = 2–6 mice per group. K, Western blot depicting Zbtb20 signals across tissues and genotypes is shown on top. Samples from replicate groups of mice were loaded on the left and right part of the gel, respectively. Gapdh was used as a loading control. Quantitations of Western blot signals are shown below. Zbtb20 signals were normalized to Gapdh signals and mean Zbtb20/Gapdh ratios in the cortex of WT mice were defined as 1.0; *p < 0.05, **p < 0.01, ****p < 0.0001 versus WT mice or as indicated by brackets (linear mixed model analysis with Holm–Sidak correction). Dots represent individual mice and bars are means ± SEM.
