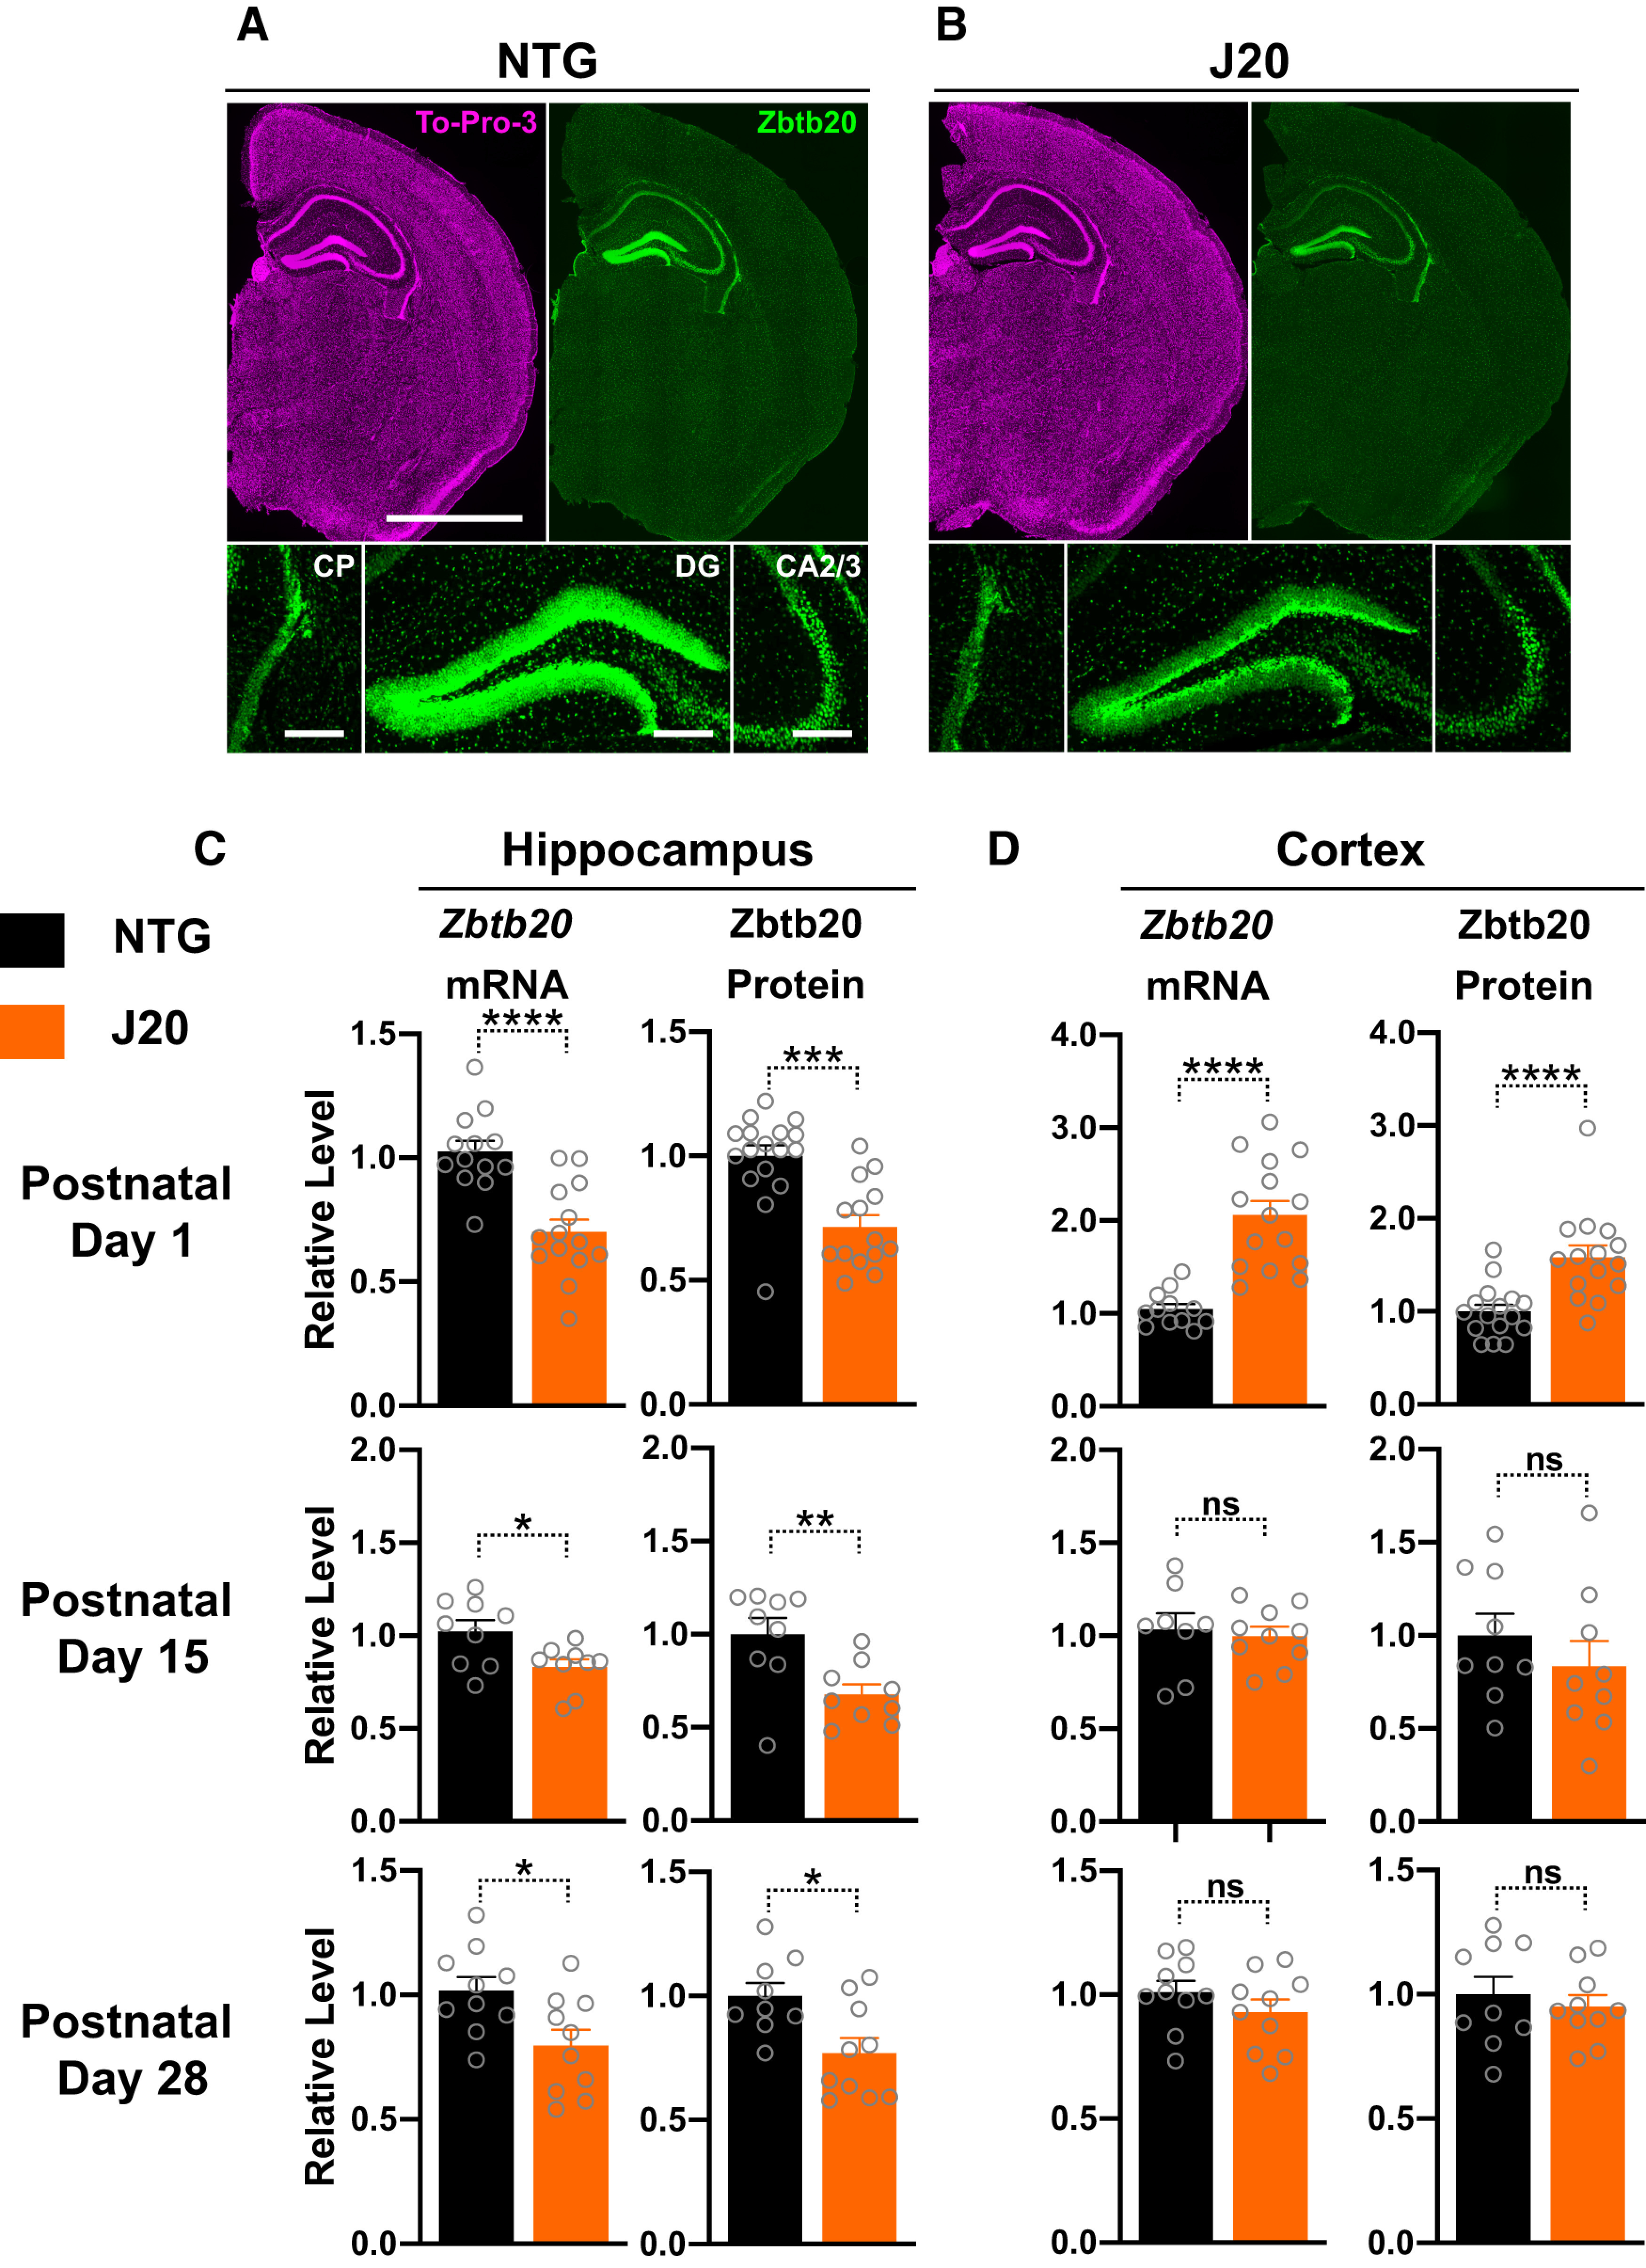
Figure 4.

Hippocampal and cortical Zbtb20 expression during postnatal development in hAPP-J20 mice. A,B, Coronal brain sections from three- to four-week-old mice of the indicated genotypes were stained with TO-PRO-3 (top-left) to identify nuclei, labeled with an antibody against Zbtb20 (top-right and bottom rows), and imaged by epifluorescence microscopy as in Figure 2. Hemibrain sections (scale bar: 2 mm) are shown at the top and magnified views (scale bar: 200 μm) of the indicated brain regions at the bottom. C,D, Zbtb20 mRNA and protein levels in the hippocampus (C) and cortex (D) of hAPP-J20 mice and NTG littermate controls at postnatal days 1 (top), 15 (middle), or 28 (bottom) were measured by RT-qPCR (left) and Western blot (right) analysis, respectively, using tissues from opposite hemibrains of the same mice. Relative Zbtb20 mRNA levels were determined as in Figure 2 except that mean Zbtb20/Gapdh mRNA ratios in matching brain regions of NTG mice were defined as 1.0. Relative Zbtb20 protein levels were normalized to β-tubulin levels and mean Zbtb20/β-tubulin ratios in matching brain regions of WT mice were defined as 1.0; n = 8–17 mice per group; *p < 0.05, **p < 0.01, ***p < 0.001, ****p < 0.0001 by two-tailed permutation test (C, postnatal day 1, protein), unpaired two-tailed t test with Welch correction (D, postnatal day 1, mRNA), or unpaired two-tailed Student’s t test (C,D, all other graphs). ns, not significant. Dots represent individual mice and bars are means ± SEM.
