
Figure 9.
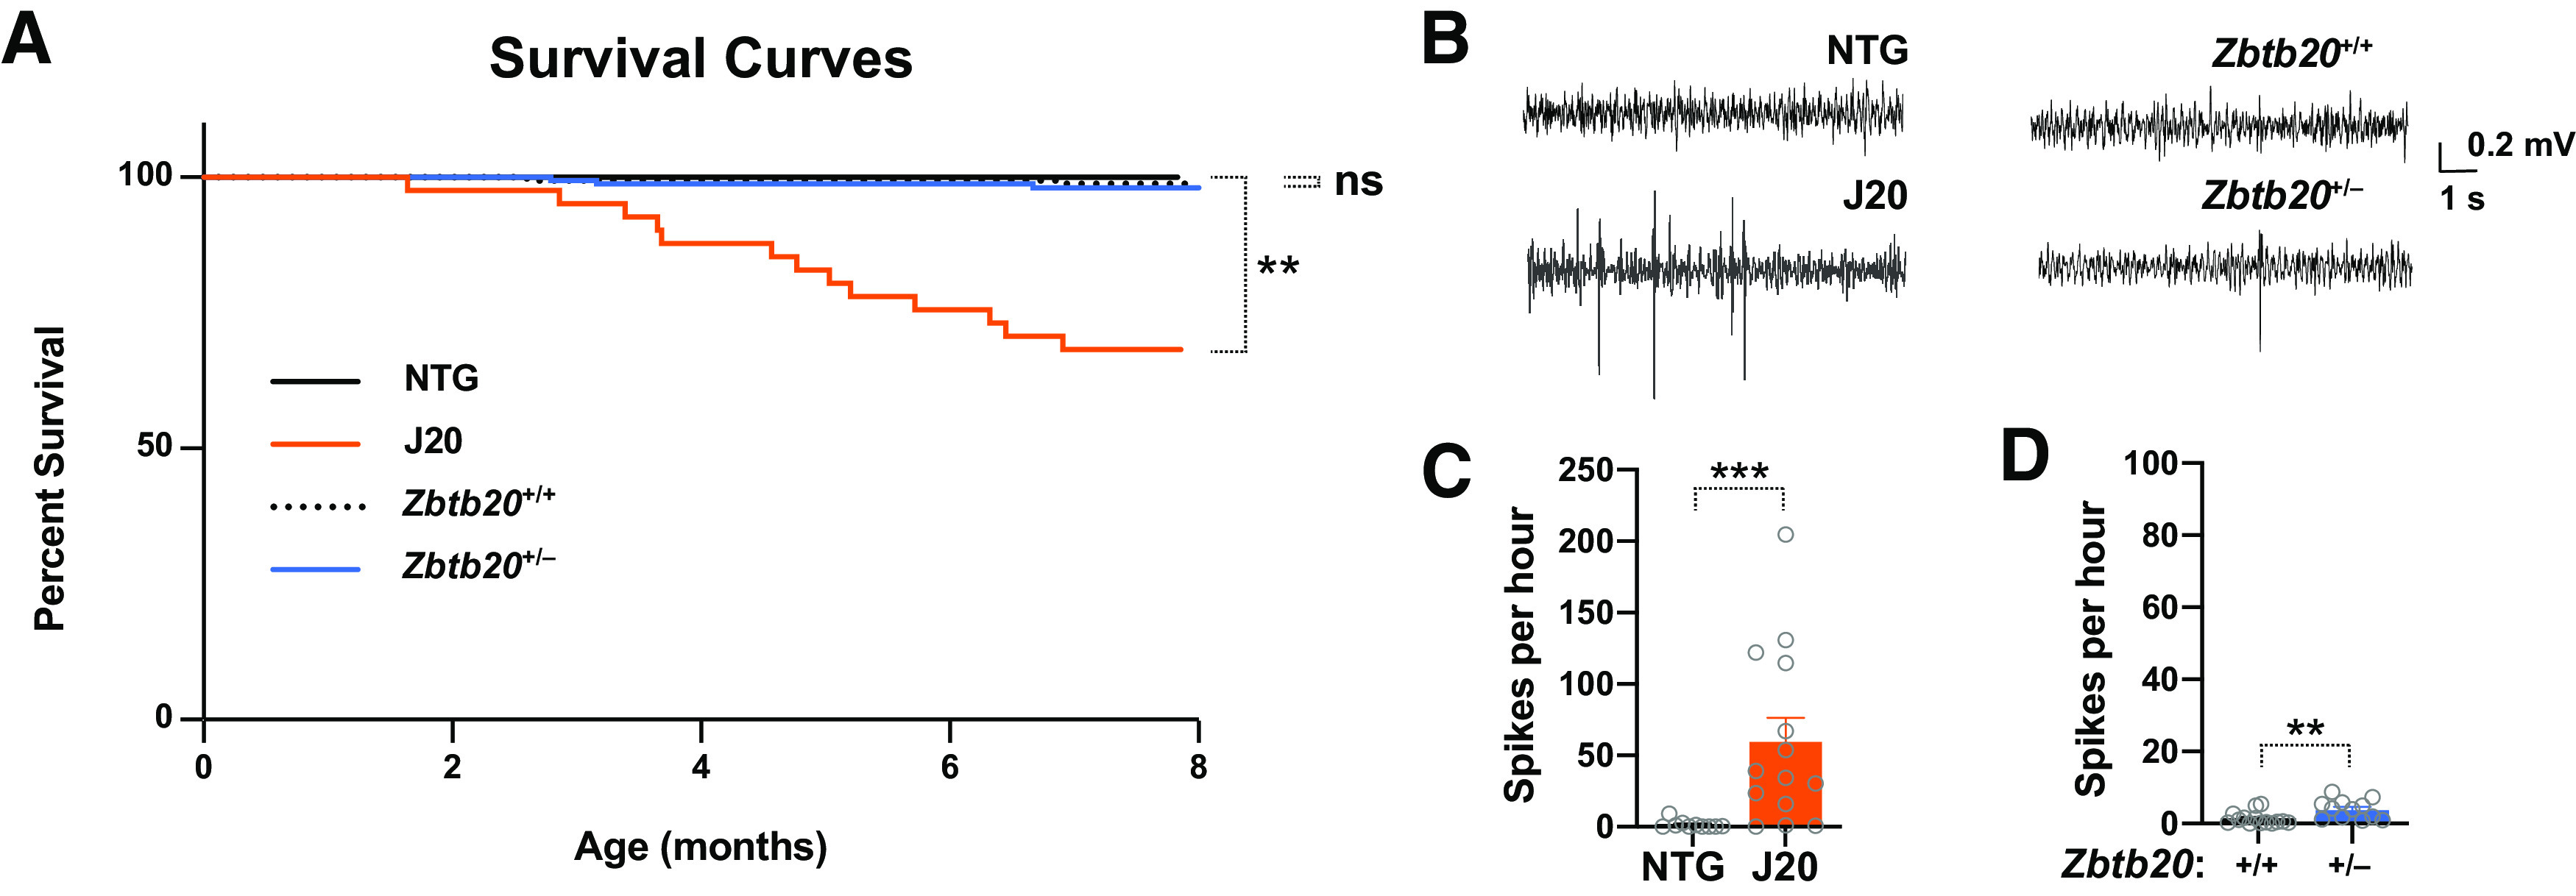
Survival and EEG activity in hAPP-J20 mice, Zbtb20+/– mice, and controls. A, Kaplan–Meier survival curves of the indicated genotypes. The hAPP-J20 and NTG data were described in a previous publication (Johnson et al., 2020). B–D, Intracranial EEG recordings were obtained from resting mice of the indicated genotypes at 9–11 months of age. B, Representative traces depicting multiple epileptiform spikes in an hAPP-J20 mouse (bottom-left), a single spike in a Zbtb20+/– mouse (bottom-right), and normal EEG activity in control mice (top). C,D, Spike frequencies measured in hAPP-J20 (C) and Zbtb20+/– (D) mice and age-matched controls from each of these lines (C,D) while they were resting. Note the different y-axis scales in these panels; n = 12–14 male mice per group; **p < 0.01, ***p < 0.001 by Mantel–Cox log-rank test (A) or unpaired two-tailed Student’s t test (C,D). ns, not significant. Dots represent individual mice and bars are means ± SEM.