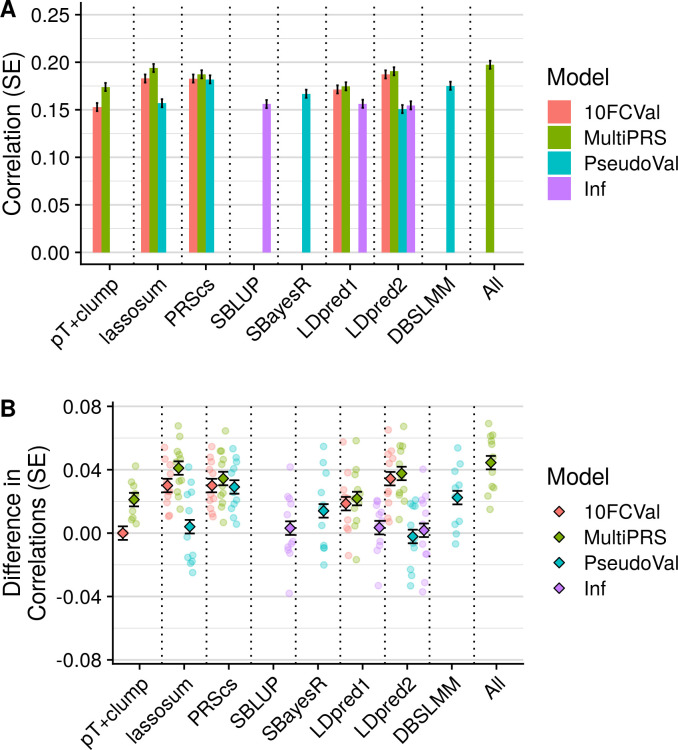
Fig 2. Polygenic scoring methods comparison for UKB target sample with 1KG reference.
A) Average test-set correlation between predicted and observed values across phenotypes. B) Average difference between observed-prediction correlations for the best pT+clump polygenic score and all other methods. The average difference across phenotypes are shown as diamonds and the difference for each phenotype shown as transparent circles. Shows only results based on the UKB target sample when using the 1KG reference. Error bars indicate standard error of correlations for each method. 10FCVal represents a single polygenic score based on the optimal parameter as identified using 10-fold cross-validation. Multi-PRS represents an elastic net model containing polygenic scores based on a range of parameters, with elastic net shrinkage parameters derived using 10-fold cross-validation. PseudoVal represents a single polygenic score based on the predicted optimal parameter as identified using pseudovalidation, which requires no tuning sample. Inf represents a single polygenic score based on the infinitesimal model, which requires no tuning sample.

