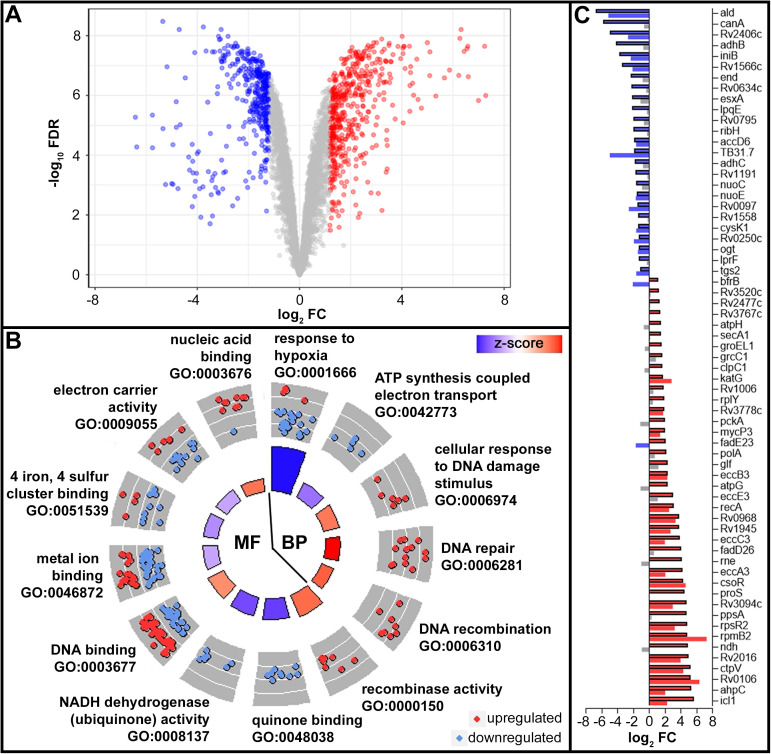
Fig 2. Adaptive response to Zn2+ limitation in Mtb.
(A) Volcano plot of DE genes (absFC >2, FDR <0.05) in Mtb H37Rv in ZLM vs. ZRM. Genes colored in red, blue, and grey are significantly upregulated, downregulated or not significantly regulated in ZLM vs. ZRM, respectively. (B) Circle plot showing GO terms of biological processes (BP) and molecular functions (MF) significantly enriched in the list of DE genes in ZLM. Each pie slice of the circle is labeled with the enriched GO term, the outer circle shows a scatter plot of DE genes with the given GO annotation and their log2FC values where red circles display upregulated and blue circles downregulated genes in ZLM vs. ZRM. The color of bars in the inner circle indicates whether the given biological process is more likely to be increased (red) or decreased (blue) in the dataset and the height represents the -log10(FDR) for the enriched term (larger bars have smaller FDR). (C) Horizontal bar graph showing the overlap between transcript and protein expression for the 65 DE proteins identified in ZLM (absFC >1.5, FDR <0.05). For each gene, the bar on top (black outline) represents the log2FC value of the protein and the bar below it (no outline) represents the log2FC value of its transcript. Red bars show upregulation and blue bars show downregulation of the protein or transcript in ZLM vs. ZRM while grey bars represent no significant differential expression for transcripts. RNA and proteins for DE analysis were isolated from the same cultures of day 10 cells from ZRM (n = 3) and ZLM (n = 3).

