Fig 3.
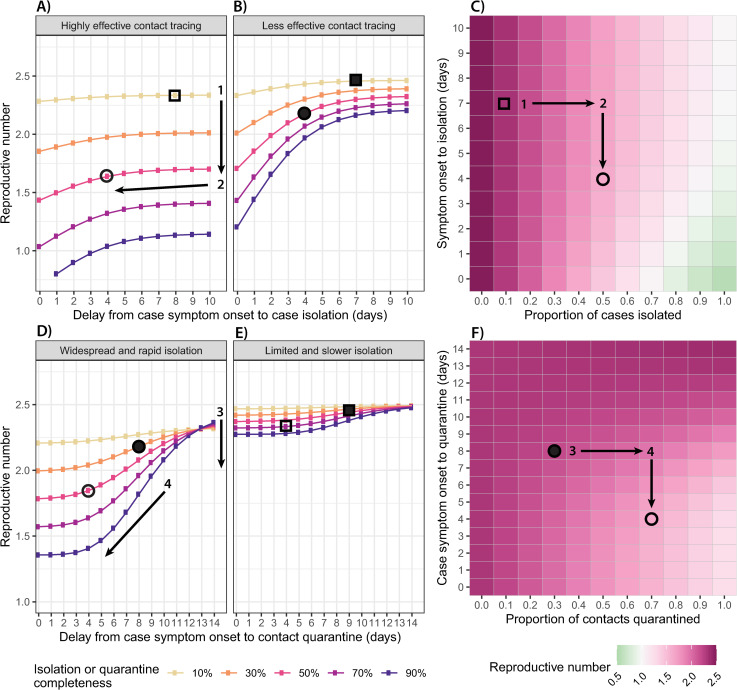
Improvements to case isolation and contact quarantine: Impact of case isolation timing (x-axis) and completeness (line colors) on the effective reproductive number (y-axis) for (A) a highly effective contact tracing program and (B) a less effective contact tracing program. (C) Heat map of the effective reproductive number across a range of case isolation timing (y-axis) and completeness (x-axis) scenarios, assuming that contact tracing is highly effective. Impact of contact tracing timing (x-axis) and completeness (line colors) on the effective reproductive number (y-axis) for (D) a widespread and rapid case isolation scenario and (E) a less effective and slower case isolation scenario. (F) Heat map of the effective reproductive number across a range of contact tracing timing (y-axis) and completeness (x-axis) scenarios, assuming that detection and isolation of index cases is widespread and rapid. For all panels, the open shapes mark example scenarios with highly effective contact tracing (70% quarantined on average 4 days after case symptom onset) in contrast to the filled shapes of a less effective contact tracing scenario (30% quarantined after 8 days). Circles mark example scenarios with widespread and rapid case isolation (50% isolated on average 4 days after case symptom onset) in contrast to squares, which have limited and slower case isolation (10% isolated after 7 days). Shapes display consistent scenarios across all panels in the figure.

