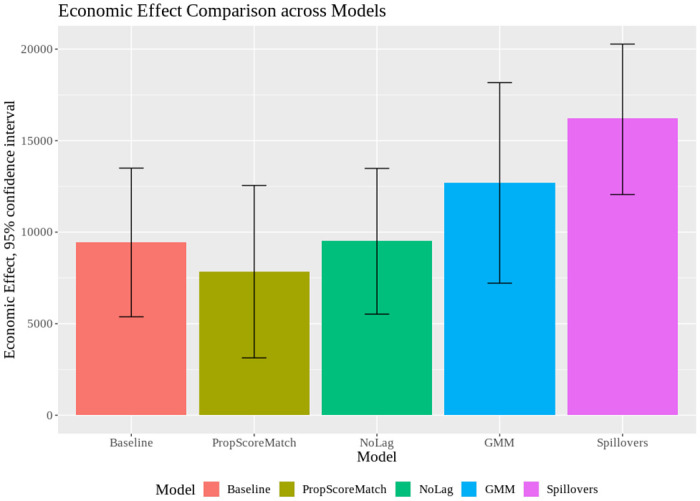
Fig 2. Economic effect comparison across models.

Economic effects across models. For the back-of-the-envelope calculation, the number of human lives saved (y-axis) is estimated using a 24-days treatment period, the mean shutdown exposure (see Table 1) and a 60.36 million population (except for “Spillovers”, which is net of the population in business centres). Segments centered at the top of each bar denote 95 percent confidence intervals of the regression coefficient of interest (i.e., on d11 × Shutd11) of the respective model specification (x-axis). Models: Baseline; PropScoreMatch; NoLag; GMM; Spillovers.
