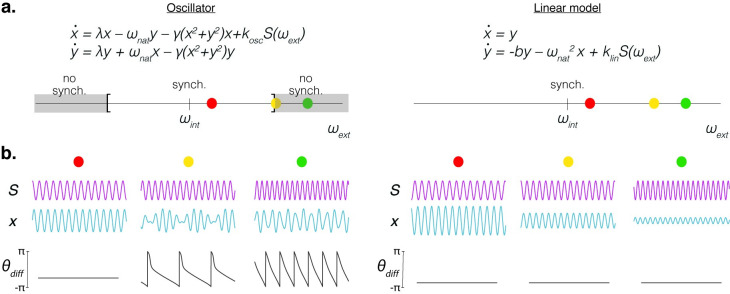
Fig 4. Comparison between an oscillator and a non-oscillator–like systems.
(a) Upper panel: set of equations defining the different models. An oscillator-like model (Stuart–Landau) on the left; a linear model on the right. Lower panel: system’s behavior for different frequency values (ωext) of the external rhythmic signal (S). For the oscillator, the synchronization between the system and the external force vanishes when the external frequency departs from the internal one (gray area in the left panel); for the linear model, instead, synchrony exists regardless of the value adopted by the external frequency. (b) Behavior of the 2 models (blue traces; oscillator on the left, linear model on the right) for rhythmic inputs (magenta traces) of different frequencies (colored dots; red, yellow, and green correspond to ωext = 4.5, 5, and 6.2 Hz, respectively). The lower panel displays in gray the time evolution of the phase difference between the system output and the corresponding input.

