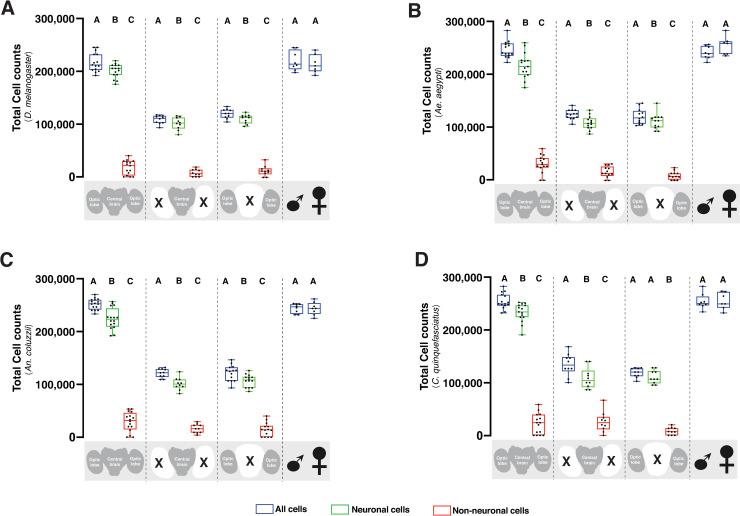
Fig 2. Quantification of the cell population in vinegar fly and mosquito brains.
Box plot showing total cell counts, neuronal, and non-neuronal cell population in the whole brain, central brain, and optic lobe of D. melanogaster (2A), Ae. aegypti (2B), An. coluzzii (2C), and C. quiquefasciatus (2D). Blue plots represent all cells, while green and red plots represent neuronal and non-neuronal cells, respectively. Different groups (whole brain, central brain, optic lobes, and sex) are separated by dashed lines. Each data point represents an average of three brains. The number of trials for whole brain (n = 15), central brain (n = 10), optic lobes (n = 10), male (n = 8), and female (n = 7) is consistent for all animals. Within each group, different letters are statistically different (P < 0.05) when analyzed by one-way ANOVA with Tukey’s post hoc test. Statistical comparisons between male and female total cell was performed by T-Test. Data analysis was performed using the GraphPad Prism 9 software package (GraphPad Software, San Diego, CA, USA).

