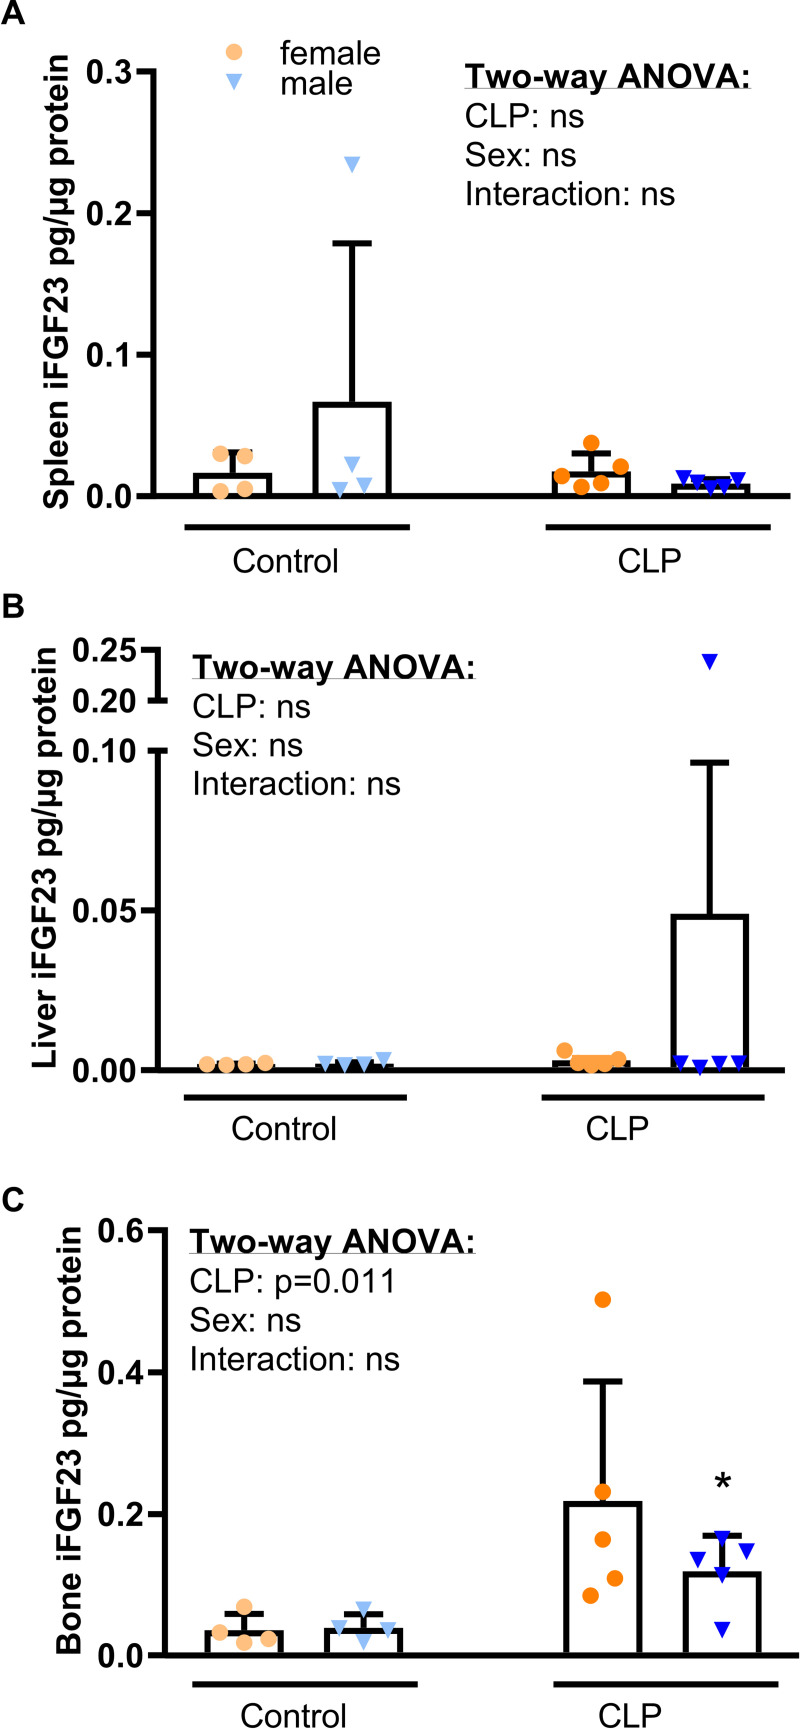
Fig 3. iFGF23 protein expression in spleen, liver and bone after CLP.
(A) Splenic, (B) hepatic and (C) bony iFGF23 protein expression measured in lysates from spleen, liver and bone by ELISA, 48 h post-surgery (n = 4–5 per group). Data are mean ± SD. Each symbol represents an individual sample. Insets show results from two-way ANOVA. *, P < 0.05 vs. healthy controls within same sex by Student’s t-test with Welch correction.

