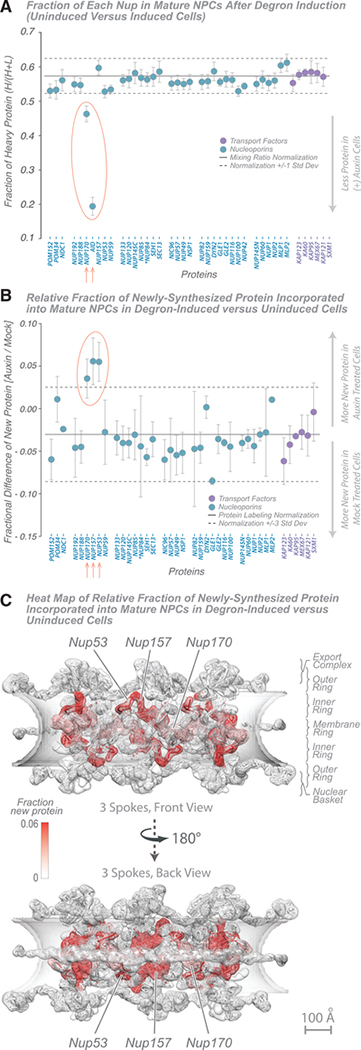
Figure 5. NPC Dynamics after Induced Degradation of AID-Nup170 Protein.
(A) Fraction of each Nup in mature NPCs after degron induction (wild-type versus Nup170-AID strains). A doubling rate normalization line (solid black line; 1 standard deviation, dashed black lines) indicates the difference in labeling rates between the strains, calculated from other abundant cytoplasmic proteins. Proteins with significant deviation (p < 0.05) are indicated in red. The average of 2 experiments is shown; error bars show the range of the two values. Tagged Nup84 is indicated by an asterisk.
(B) Fraction of newly synthesized Nup incorporated into mature NPCs after degron induction (wild-type versus Nup170-AID strains) and new protein incorporation difference for Nups in AID-Nup170-degraded and -undegraded (mock-treated) cells; error bars, standard deviation. The fractional changes were also calculated for other abundant cytoplasmic proteins, which represent nonspecific ultrafast-exchanging proteins (stable protein average, solid black line; 3 standard deviations, dashed black lines). Proteins with significant deviation (p < 0.01) from the normal are indicated in red. The average of three experiments is shown; error bars are combined standard error of the mean. Tagged Nup84 is indicated by an asterisk.
(C) Heatmap on the molecular structure of NPC (Figure 2; Kim et al., 2018) of Nup exchange increase after AID-Nup170 degradation (white, no new protein; red, 0.06 [6%] new protein). Scale bar, 100 Å.

