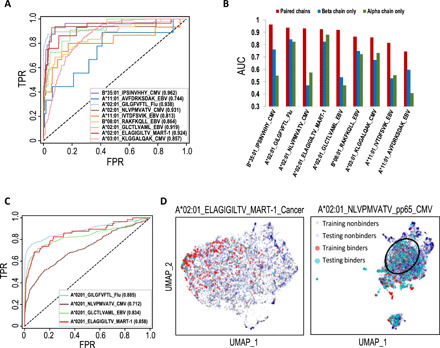
Fig. 3. TCRAI prediction on the high-throughput dataset.

(A) ROC curves for TCRAI prediction on the nine most abundant pMHC binding repertoires. Binders are unique TCRs that bind to a particular pMHC, and nonbinders are unique TCRs that bind to other pMHCs. Paired αβ TCR sequences were used as input data. (B) Comparisons of TCRAI prediction on TCRα only, TCRβ only, and paired αβ chains as input data. (C) ROC curves for the independent tests of four overlapping pMHC repertoires between the curated public dataset and the high-throughput dataset. TCRAI was trained using pMHC repertoires identified from the high-throughput dataset and was tested on the curated public dataset. (D) UMAPs of both the training (high-throughput data) and testing (the gold-standard data) TCRAI fingerprints extracted from the models trained by the high-throughput data. The left panel shows the strong overlap between MART-1_cancer training and testing sets, while the poor overlap of NLVPMVATV_pp65_CMV training and testing datasets is shown in the right panel. The black circle highlights the region with almost no overlapping fingerprints of training and testing binders. UMAP, Uniform Manifold Approximation and Projection.
