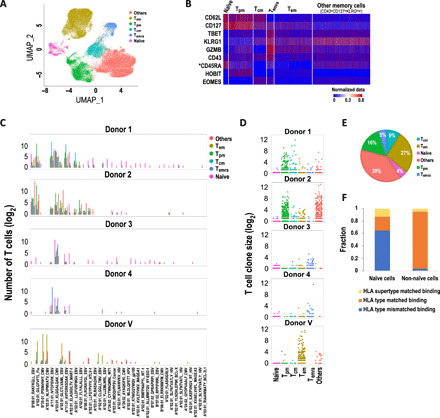
Fig. 5. Immune phenotypes of pMHC binding CD8+ T cells.

(A) Classification of pMHC binding cells. (B) Heatmap of the expression of CD8+ T cell subtype marker genes and proteins. *: protein expression measured by CITE-seq. (C) pMHC binding landscape by CD8+ T cell immune subtypes. Bars indicate the number of pMHC binding T cells in log2 scale. (D) Expanded clonotypes are enriched in the non-naïve compartment. Each dot represents a unique TCR clone. (E) Pie chart of subpopulations of pMHC binding CD8+ T cells. (F) Fraction of HLA type matched and mismatched binding naïve and non-naïve T cells. Tpm, peripheral memory cells; Tcm, central memory cells; Tem, effector memory cells; Temra, terminally differentiated effector memory cells; Others, other memory cells with the marker gene expression pattern CD43loCD127loKLRG1high.
