
Fig. 4. C2C12 growth on dECM scaffolds.
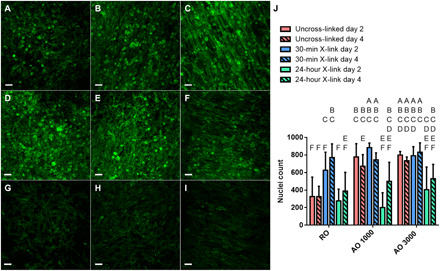
Cell growth was assessed after 2 and 4 days in growth media through staining of the actin cytoskeleton. (A to I) Representative confocal images of cell-laden dECM constructs after 4 days of growth are shown. Immunofluorescence staining of actin is shown in green. Scale bar represents 50 μm and is the same across images. (J) Cell number was assessed on days 2 and 4 of culture in growth media. Values represent means ± SD (n = 6). Bars that share letters are not significantly different. Conversely, bars that do not share a letter are significantly different (P < 0.05).