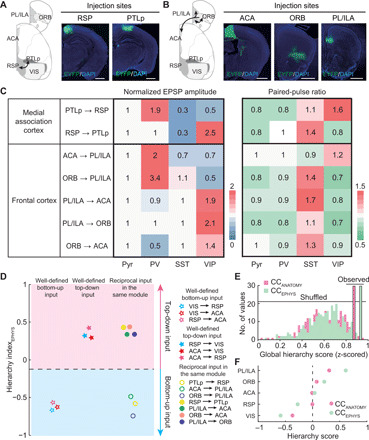
Fig. 5. Synaptic properties of reciprocal CC inputs in the same module.

(A and B) Schematic diagram and viral injection sites for examined inputs. Scale bars, 1 mm. The image of RSP and ACA injection sites are the same as in Fig. 4. (C) Matrix of normalized EPSP amplitude (left) and PPR (right) for reciprocal CC inputs in the same module. EPSP amplitude was normalized by Pyr-neuron response. The PPR is measured by dividing the amplitude of the second EPSP into that of the first EPSP. (D) Decision boundary for the classification of bottom-up and top-down inputs derived from ClassifierEPHYS, trained with the HIEPHYS of well-defined bottom-up and top-down CC inputs. (E) Global hierarchy scores for CC connections based on HIEPHYS (green), compared to the scores based on HIANATOMY (pink). (F) Hierarchy scores based on HIEPHYS (green) or HIANATOMY (pink) of CC connections. Included are the cortical areas with completed electrophysiological data of reciprocal connections. Cortical areas are rank-ordered by their CCANATOMY hierarchy scores.
