
Fig. 1. Single-nucleus chromatin accessibility and transcriptome profiling of human hearts.
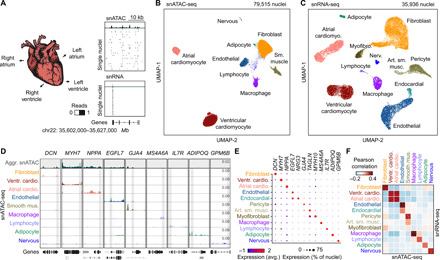
(A) snATAC-seq and snRNA-seq were performed on nuclei isolated from cardiac chambers from four human donors without cardiovascular pathology. snATAC-seq: n = 4 (left ventricle), n = 4 (right ventricle), n = 3 (left atrium), and n = 2 (right atrium); snRNA-seq: n = 2 (left ventricle), n = 2 (right ventricle), n = 2 (left atrium), and n = 1 (right atrium). (B) Uniform manifold approximation and projection (UMAP) (108) and clustering analysis of snATAC-seq data reveal nine clusters. Each dot represents a nucleus colored by cluster identity. (C) UMAP (108) and clustering analysis of snRNA-seq data reveal 12 major clusters. Each dot represents a nucleus colored by cluster identity. Nerv., nervous. Art. sm. musc., arterial smooth muscle. (D) Genome browser tracks (141) of aggregate chromatin accessibility profiles [scale: reads per million (RPM)] at selected representative marker gene examples for individual clusters and for all nuclei pooled together into an aggregated heart dataset (top track, gray). Black genes below tracks represent the indicated marker genes, nonmarker genes are grayed. (E) Dot plot illustrating expression of representative marker gene examples in individual snRNA-seq clusters. (F) Heatmap illustrating the correlation between clusters defined by chromatin accessibility and transcriptomes. Pearson correlation coefficients were calculated between chromatin accessibility at cCREs within 2 kbp of annotated promoter regions (76) and expression of the corresponding genes for each cluster.